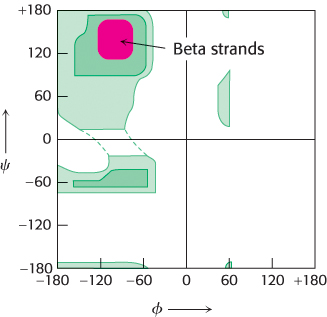
Ramachandran plot for β strands.
The red area shows the sterically allowed conformations of extended, β-stran
d-
like structures.