Gene-expression analysis with the use of microarrays. The expression levels of thousands of genes can be simultaneously analyzed with DNA microarrays. Here, an analysis of 1733 genes in 84 breast tumor samples reveals that the tumors can be divided into distinct classes based on their gene-expression patterns. In this “heat map” representation, each row represents a different gene and each column represents a different breast tumor sample (i.e., a separate microarray experiment). Red corresponds to gene induction and green corresponds to gene repression.
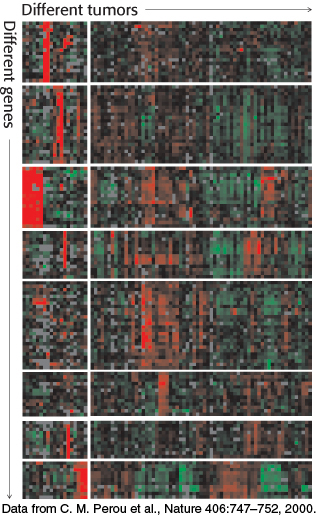
[Data from C. M. Perou et al., Nature 406:747–752, 2000.]