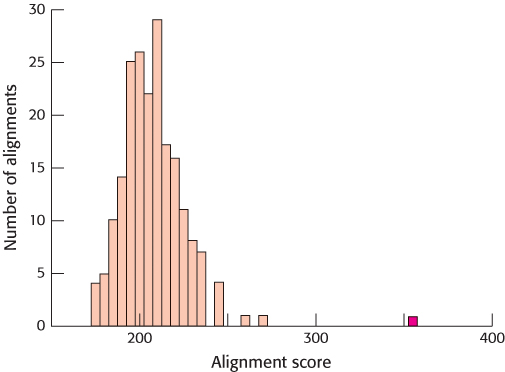
Statistical comparison of alignment scores. Alignment scores are calculated for many shuffled sequences, and the number of sequences generating a particular score is plotted against the score. The resulting plot is a distribution of alignment scores occurring by chance. The alignment score for unshuffled α-hemoglobin and myoglobin (shown in red) is substantially greater than any of these scores, strongly suggesting that the sequence similarity is significant.