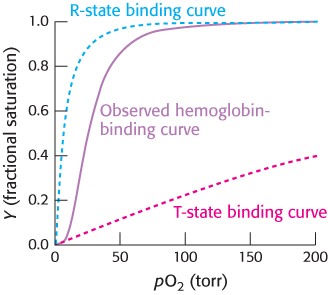
T-to-R transition. The binding curve for hemoglobin can be seen as a combination of the binding curves that would be observed if all molecules remained in the T state or if all of the molecules were in the R state. The sigmoidal curve is observed because molecules convert from the T state into the R state as oxygen molecules bind.