APPENDIX: Visualizing Molecular Structures II: Proteins
Scientists have developed powerful techniques for the determination of protein structures, as will be considered in Chapter 3. In most cases, these techniques allow the positions of the thousands of atoms within a protein structure to be determined. The final results from such an experiment include the x, y, and z coordinates for each atom in the structure. These coordinate files are compiled in the Protein Data Bank (http://www.pdb.org) from which they can be readily downloaded. These structures comprise thousands or even tens of thousands of atoms. The complexity of proteins with thousands of atoms presents a challenge for the depiction of their structure. Several different types of representations are used to portray proteins, each with its own strengths and weaknesses. The types that you will see most often in this book are space-filling models, ball-and-stick models, backbone models, and ribbon diagrams. Where appropriate, structural features of particular importance or relevance are noted in an illustration’s legend.
Space-Filling Models
Space-filling models are the most realistic type of representation. Each atom is shown as a sphere with a size corresponding to the van der Waals radius of the atom (Section 1.3). Bonds are not shown explicitly but are represented by the intersection of the spheres shown when atoms are closer together than the sum of their van der Waals radii. All atoms are shown, including those that make up the backbone and those in the side chains. A space-filling model of lysozyme is depicted in Figure 2.66.
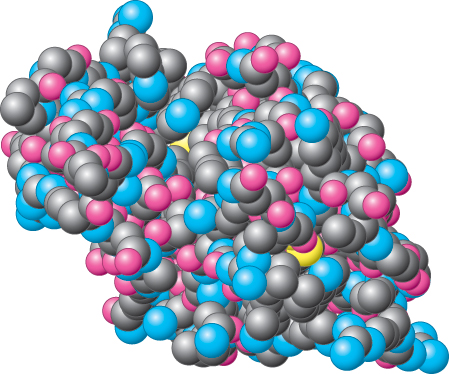
Figure 2.66: Space-filling model of lysozyme. Notice how tightly packed the atoms are, with little unfilled space. All atoms are shown with the exception of hydrogen atoms. Hydrogen atoms are often omitted because their positions are not readily determined by x-ray crystallographic methods and because their omission somewhat improves the clarity of the structure’s depiction.
Space-filling models convey a sense of how little open space there is in a protein’s structure, which always has many atoms in van der Waals contact with one another. These models are particularly useful in showing conformational changes in a protein from one set of circumstances to another. A disadvantage of space-filling models is that the secondary and tertiary structures of the protein are difficult to see. Thus, these models are not very effective in distinguishing one protein from another—many space-filling models of proteins look very much alike.
Ball-and-Stick Models
Ball-and-stick models are not as realistic as space-filling models. Realistically portrayed atoms occupy more space, determined by their van der Waals radii, than do the atoms depicted in ball-and-stick models. However, the bonding arrangement is easier to see because the bonds are explicitly represented as sticks (Figure 2.67). A ball-and-stick model reveals a complex structure more clearly than a space-filling model does. However, the depiction is so complicated that structural features such as α helices or potential binding sites are difficult to discern.
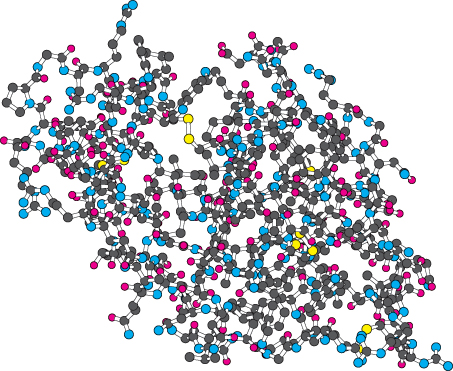
Figure 2.67: Ball-and-stick model of lysozyme. Again, hydrogen atoms are omitted.
Because space-filling and ball-and-stick models depict protein structures at the atomic level, the large number of atoms in a complex structure makes it difficult to distinguish the relevant structural features. Thus, representations that are more schematic—such as backbone models and ribbon diagrams—have been developed for the depiction of macromolecular structures. In these representations, most or all atoms are not shown explicitly.
Backbone Models
Backbone models show only the backbone atoms of a polypeptide chain or even only the α-carbon atom of each amino acid. Atoms are linked by lines representing bonds; if only α-carbon atoms are depicted, lines connect α-carbon atoms of amino acids that are adjacent in the amino acid sequence (Figure 2.68). In this book, backbone models show only the lines connecting the α-carbon atoms; other carbon atoms are not depicted.
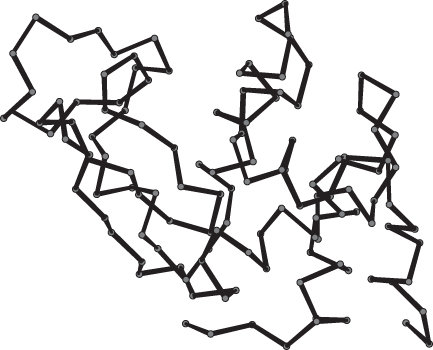
Figure 2.68: Backbone model of lysozyme.
A backbone model shows the overall course of the polypeptide chain much better than a space-filling or ball-and-stick model does. However, secondary structural elements are still difficult to see.
Ribbon Diagrams
Ribbon diagrams are highly schematic and most commonly used to accent a few dramatic aspects of protein structure, such as the α helix (depicted as a coiled ribbon or a cylinder), the β strand (a broad arrow), and loops (thin tubes), to provide clear views of the folding patterns of proteins (Figure 2.69). The ribbon diagram allows the course of a polypeptide chain to be traced and readily shows the secondary structural elements. Thus, ribbon diagrams of proteins that are related to one another by evolutionary divergence appear similar (Figure 6.15), whereas unrelated proteins are clearly distinct.
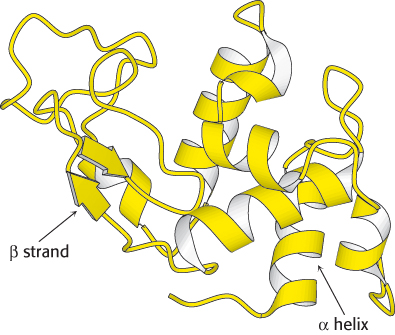
Figure 2.69: Ribbon diagram of lysozyme. The α helices are shown as coiled ribbons; β strands are depicted as arrows. More irregular structures are shown as thin tubes.
In this book, coiled ribbons will be generally used to depict α helices. However, for membrane proteins, which are often quite complex, cylinders will be used rather than coiled ribbons. This convention will also make membrane proteins with their membrane-spanning α helices easy to recognize (Figure 12.18).
Bear in mind that the open appearance of ribbon diagrams is deceptive. As noted earlier, protein structures are tightly packed and have little open space. The openness of ribbon diagrams makes them particularly useful as frameworks in which to highlight additional aspects of protein structure. Active sites, substrates, bonds, and other structural fragments can be included in ball-and-stick or space-filling form within a ribbon diagram (Figure 2.70).
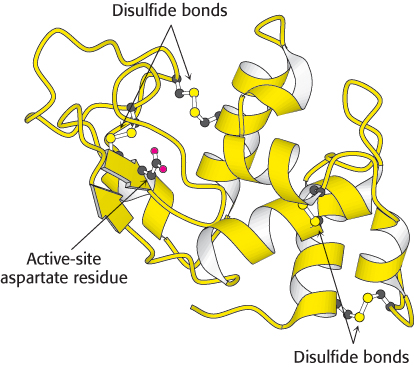
Figure 2.70: Ribbon diagram of lysozyme with highlights. Four disulfide bonds and a functionally important aspartate residue are shown in ball-and-stick form.