Teaching and Learning
As we have just described, school-
Traditionally, learning occurred at home, but now United Nations data find that more than 95 percent of the world’s 7-
Indeed, in many developing nations the number of students in elementary school exceeds the number of school-
International Schooling
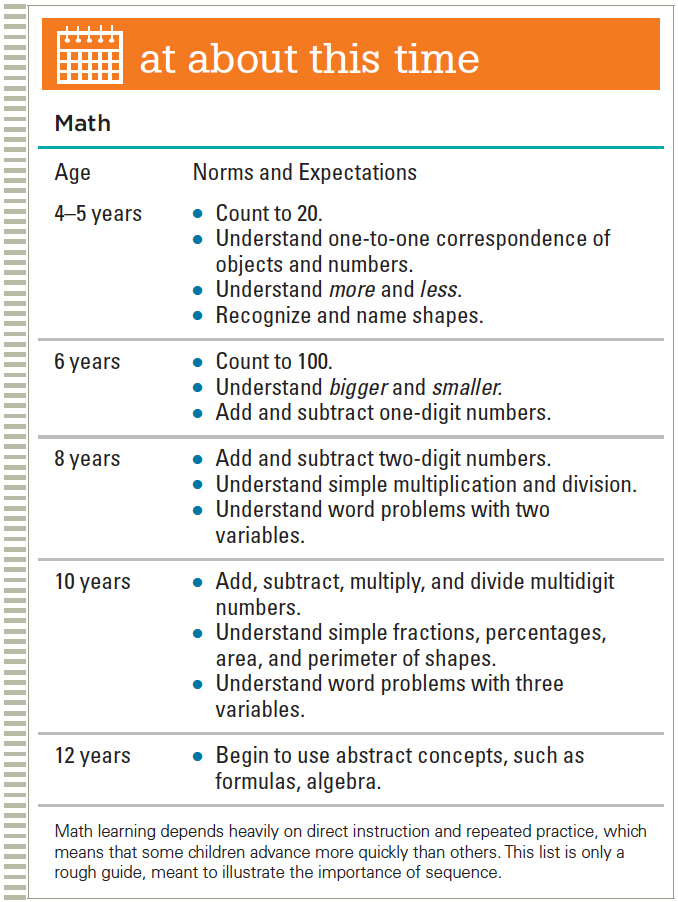
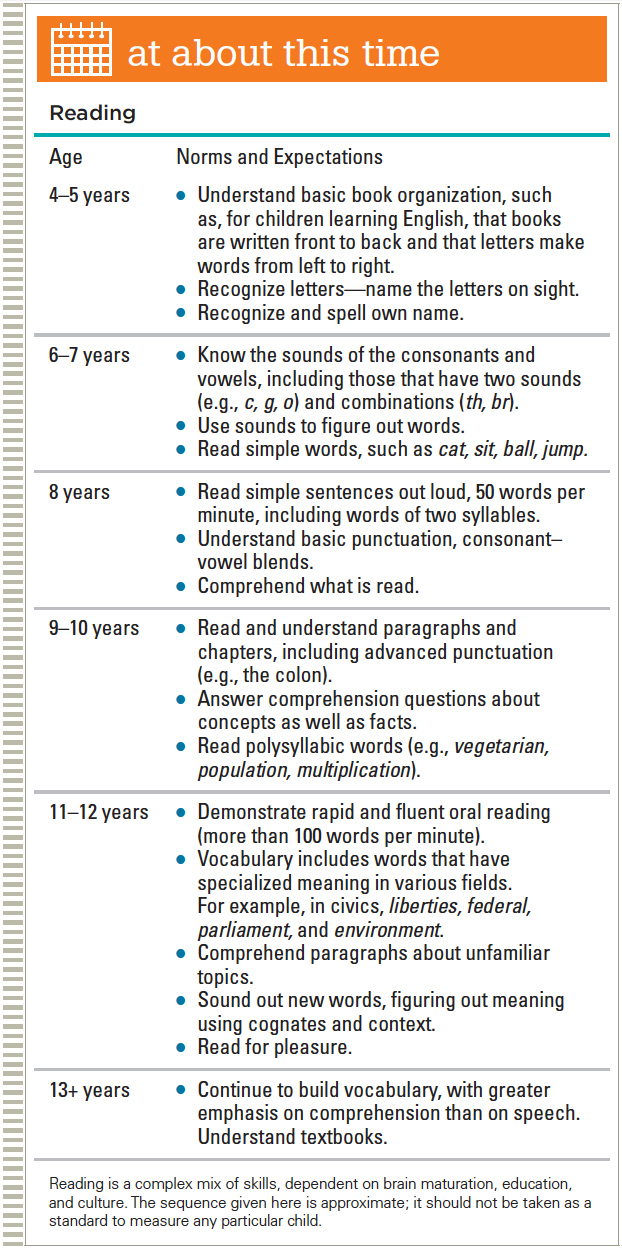
Everywhere children are taught to read, write, and do arithmetic. Because of brain maturation and sequenced learning, 6-
Nations also want their children to be good citizens. However, citizenship is not easy to teach. There is no consensus as to what good citizenship means or what developmental paths should be followed for children to learn it (Cohen & Malin, 2010). Accordingly, many children simply follow their parents example regarding everything from picking up trash to supporting a candidate for president.
393
Differences by Nation
Although literacy and numeracy (reading and math, respectively) are valued everywhere, many curriculum specifics vary by nation, by community, and by school. These variations are evident in the results of international tests, in the mix of school subjects, and in the relative power of parents, educators, and political leaders.
For example, daily physical activity is mandated in some schools but not in others. Many schools in Japan have swimming pools; virtually no schools in Africa or Latin America do. As you read in Chapter 11, some U.S. schools have no recess at all.
Geography, music, and art are essential in some places, not in others. Half of all U.S. 18-
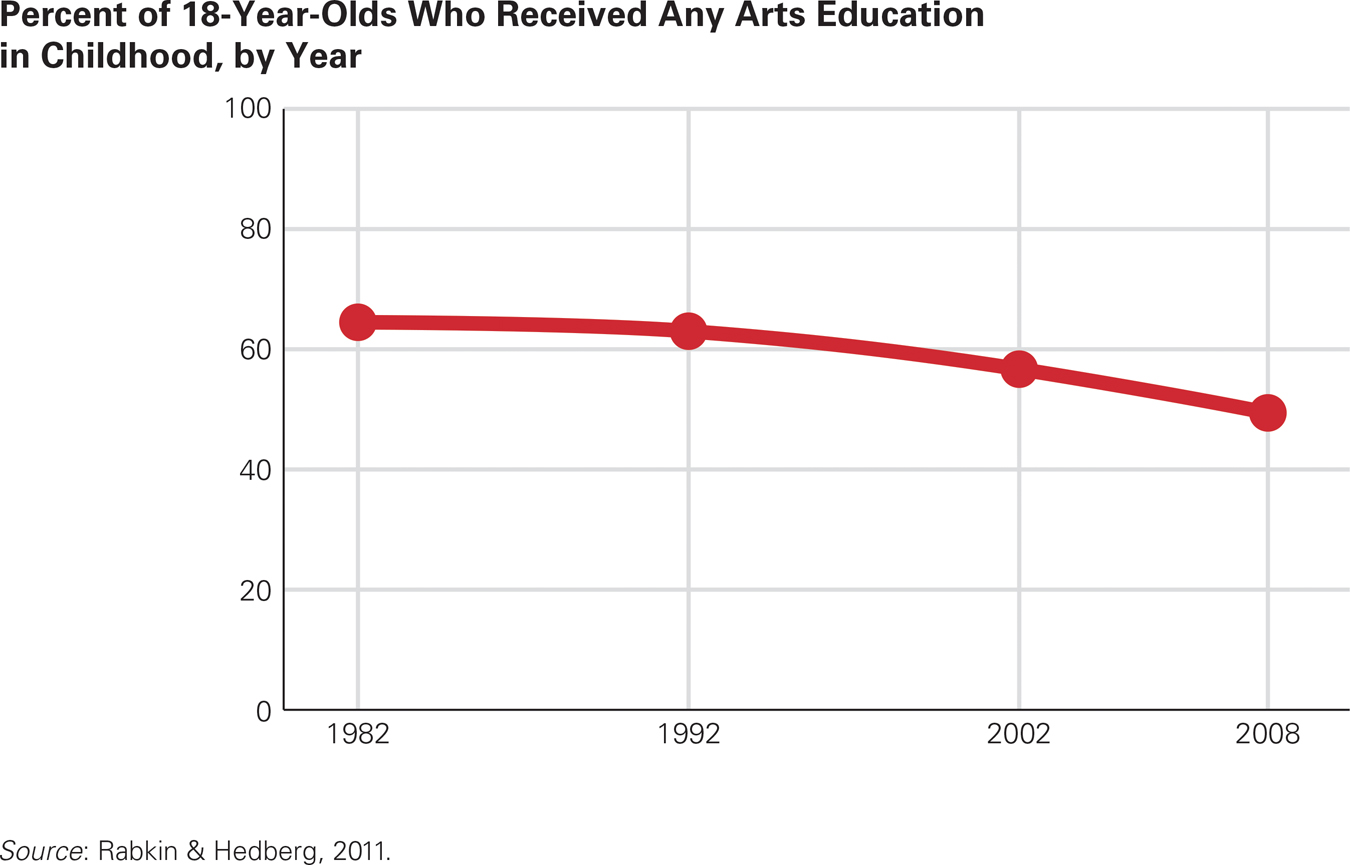
Focus on Facts As achievement test scores become the measure of learning, education in art, music, and movement has been squeezed out. Artists worry that creativity and imagination may be lost as well.
Educational practices may differ even between nations that are geographically and culturally close. For example, the average child in a primary school in Spain spends twice as much school time studying science as does the average child in Italy (145 versus 78 hours per year, respectively). Similar disparities occur in nations in which each region or district is allowed to set local standards. For example in Canada, children in the province of Quebec study science about half as much as those in Ontario (50 compared to 92 hours per year) (Snyder & Dillow, 2013).
394
Differences between one nation and another, and, in the United States, between one school and another, may be dramatic in the hidden curriculum, which includes all the implicit values and assumptions of the school. The hidden curriculum is evident in course offerings, schedules, tracking, teacher characteristics, discipline, teaching methods, sports competition, student government, extracurricular activities, and so on.
Whether students should be quiet or talkative in the classroom is part of the hidden curriculum, taught from kindergarten on. I realized this when I taught at the United Nations high school. One student, newly arrived from India, never spoke in class so I called on him. He immediately stood up to answer—
395
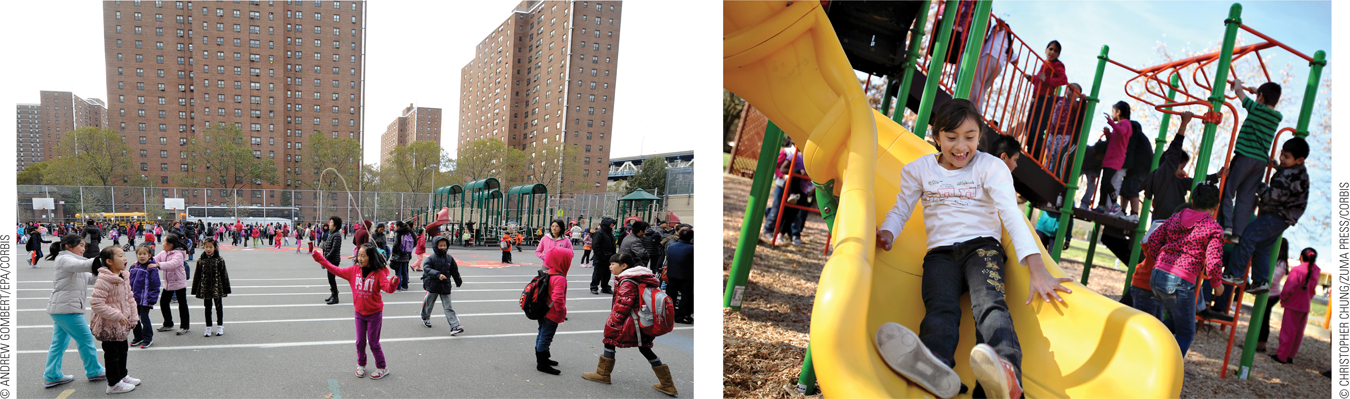
OBSERVATION QUIZ What three differences do you see between recess in New York City (left) and Santa Rosa, California (right)?
The most obvious is the play equipment, but there are two others that make some New York children eager for recess to end. Did you notice the concrete play surface and the winter jackets?
The hidden curriculum is also thought to be the underlying reason for a disheartening difference in whether elementary school students respond to their teachers’ offer of special assistance. In one study, middle-
More generally, if teachers’ gender, ethnicity, or economic background is unlike that of the students, children may conclude that education is irrelevant for them. If the school has gifted classes, the hidden message may be that all the rest of the students are not very capable.
The physical setting of the school also sends a message. Some schools have spacious classrooms, wide hallways, and large, grassy playgrounds; others have cramped, poorly equipped classrooms and cement play yards. In some nations, school is held outdoors, with no chairs, desks, or books. Sessions are canceled when it rains. What does that tell the students?
International Testing
Over the past two decades, more than 50 nations have participated in at least one massive international test of educational achievement. Longitudinal data reveal that when achievement rises, the national economy advances with it; this sequence seems causal, not merely correlational (Hanushek & Woessmann, 2009). Apparently, better-
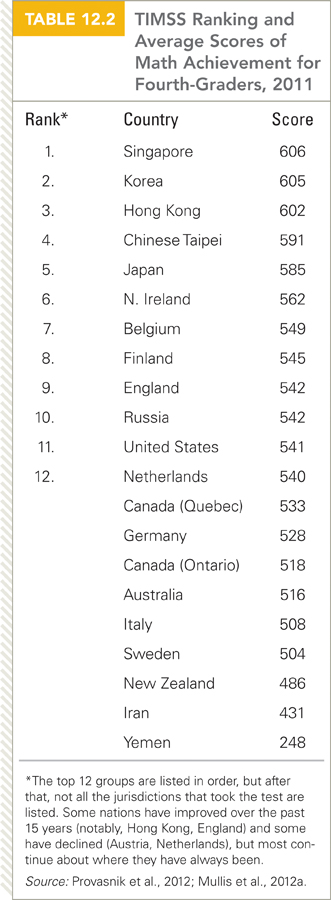
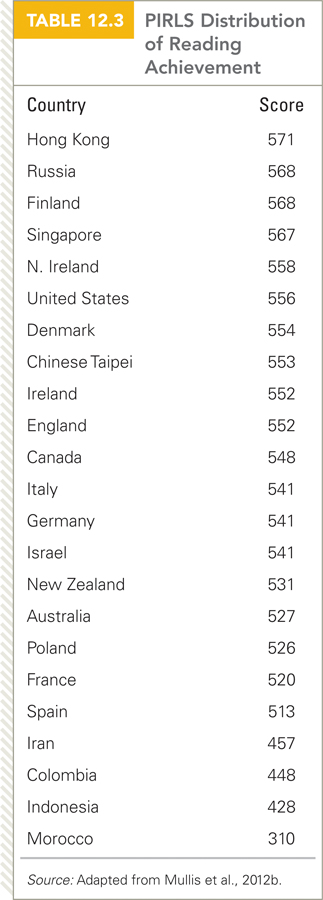
Science and math achievement are tested in the Trends in Math and Science Study (TIMSS). The main test of reading is the Progress in International Reading Literacy Study (PIRLS). These tests are given every few years, with East Asian nations usually ranking at the top. The rank of the United States has risen over the past two decades, but it is still below several nations in Eastern and Western Europe, as well as in Asia (see Table 12.2 and Table 12.3). Most developing nations in Africa or South America do not give these tests, but when they do, their scores are low.
After a wholesale reform of the educational system, Finland’s scores increased dramatically from about 1990 to 2011. Changes occurred over several years, including the abolishment of ability grouping in 1985 and curriculum reform in 1994 to encourage collaboration and active learning. Strict requirements for becoming a teacher are in place. Only the top 3 percent of Finland’s high school graduates are admitted to teachers’ colleges. They study five years at the university at no charge, earning a master’s degree in the theory and practice of education.
396
Finnish teachers are also granted more autonomy within their classrooms than is typical in other systems, and since the 1990s, they have had more time and encouragement to work with colleagues (Sahlberg, 2011). Buildings are designed to foster collaboration, with comfortable teacher’s lounges (Sparks, 2012) that reflect a hidden curriculum regarding teacher professionalism. The teachers also belong to a union—
Respect for teaching might be the reason for Finland’s success, or perhaps the reasons are more basic, such as Finland’s size, population, culture, or history.
The crucial difference may be expectations: Every child is assumed to have strengths and weaknesses that the teacher uses to find the right combination of approaches that will foster learning. Almost no child is designated for special education because all are given individualized attention.
International test results reflect educational approaches in various nations, as well as cultural values. TIMSS experts videotaped 231 math classes in Japan, Germany, and the United States (Stigler & Hiebert, 2009). The U.S. teachers taught math at a lower level than did their German and Japanese counterparts, presenting more definitions disconnected to prior learning. Few U.S. students seemed engaged in math because they felt the “teachers seem to believe that learning terms and practicing skills is not very exciting” (p. 89).
By contrast, the Japanese teachers were excited about math instruction, working collaboratively and structuring lessons so that the children developed proofs and alternative solutions, both alone and in groups. Teachers used social interaction and followed an orderly sequence (building lessons on previous knowledge). Japanese teaching reflected all three theories of cognition: children’s creative problem solving from Piaget, collaborative learning from Vygotsky, and sequencing from information processing. Since Japanese students excel on the TIMSS, the teachers’ use of strategies from all three theories may lead to student success.
397
Problems with International Benchmarks
Elaborate and extensive measures are in place to make the PIRLS and the TIMSS valid. For instance, test items are designed to be fair and culture-
The tests are far from perfect, however. Designing test items that are equally challenging to every student in every nation is impossible. Should fourth-
Al wanted to find out how much his cat weighed. He weighed himself and noted that the scale read 57 kg. He then stepped on the scale holding his cat and found that it read 62 kg. What was the weight of the cat in kilograms?
This problem involves simple subtraction, yet 40 percent of U.S. fourth-
Gender Differences in School Performance
In addition to marked national, ethnic, and economic differences, gender differences in achievement scores are reported. The PIRLS finds girls ahead of boys in verbal skills in every nation by an average of 16 points. The female advantage is not that high in the United States, with the 2011 PIRLS finding girls 10 points ahead. This meant that they were about 2 percent ahead of the average boy, an advantage—
Traditionally, boys were ahead of girls in math and science. However, the 2011 TIMSS reported that gender differences among fourth-
Unlike test results, classroom performance during elementary school shows gender differences in almost every nation. Girls have higher report card grades overall, including in math and science. Then, at puberty, girls’ grades dip, especially in science, and in college, fewer women choose STEM (Science, Technology, Engineering, Math) majors, and even fewer pursue STEM careers. For instance, in the United States as in most nations, although women earn more college degrees than men, in 2011 only 22 percent of the doctorates in engineering were awarded to women (Snyder & Dillow, 2013).

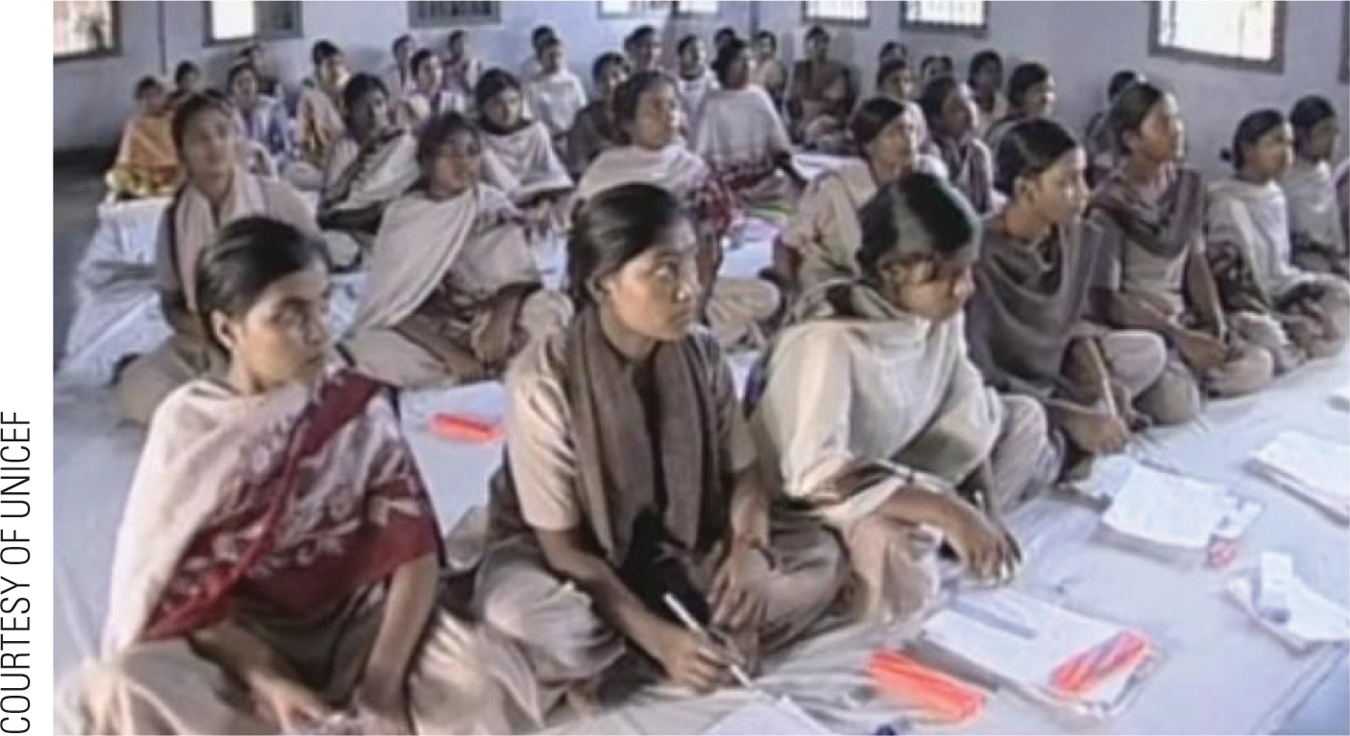
Video Activity: Educating the Girls of the World examines the situation of girls’ education around the world while stressing the importance of education for all children.
398
Many reasons for gender differences in educational attainment have been suggested, with the social context of the elementary school classroom being crucial (Legewie & DiPrete, 2012). Perhaps school itself is more connected with feminism than masculinity. Indeed, children are all expected to sit still and concentrate, which may be easier for girls than boys. If sexual attractiveness becomes crucial at puberty, girls may underachieve because they think boys will not be attracted to them if they are too smart. As adults they believe that a career in science will clash with becoming good mothers and wives.
An alternate explanation is that social prejudice and the hidden curriculum favors young girls but not young women. Since most elementary school teachers are women, girls in the early grades may feel (or be) more encouraged than boys. Then, when adolescents begin to prepare for adulthood, most seek the roles that have typically been held by their sex—
The following A Case to Study is an example: Do you think Paul became a low achiever because he was male, or because he was Mexican, or because his school failed him?
a case to study
Two Immigrants
Two children, both Mexican American, describe their experiences in their local public school in California.
Yolanda:
When I got here [from Mexico at age 7], I didn’t want to stay here, ’cause I didn’t like the school. And after a little while, in third grade, I started getting the hint of it and everything and I tried real hard in it. I really got along with the teachers…. They would start talking to me, or they kinda like pulled me up some grades, or moved me to other classes, or took me somewhere. And they were always congratulating me.
Paul:
I grew up … ditching school, just getting in trouble, trying to make a dollar, that’s it, you know? Just go to school, steal from the store, and go sell candies at school. And that’s what I was doing in the third or fourth grade…. I was always getting in the principal’s office, suspended, kicked out, everything, starting from the third grade.
[quoted in Nieto, 2000, pp. 220, 249]
Note that initially Yolanda didn’t like the United States because of school, but her teachers “kind of pulled me up.” By third grade, she was beginning to get “the hint of it.”
For Paul, school was where he sold stolen candy and where his third-
Paul was later sent to a special school, and the text implies that he was in jail by age 18. Yolanda became a successful young woman, fluently bilingual.
It would be easy to conclude that the difference was gender, since girls generally do better in school than boys, but that is too simple. Some Mexican-
Schooling in the United States
Although most national tests indicate improvements in U.S. children’s academic performance over the past decade, when U.S. children are compared with children in other nations, they are still far from the top. A particular concern is that a child’s achievement seems to be more influenced by income and ethnicity in the United States than in other nations. Some high-
399
Each state and each school district in the United States determines school policy and funding, with one result being notable disparities. For example, Massachusetts and Minnesota are consistently at the top of state achievement, and West Virginia, Mississippi, and New Mexico are at the bottom—
Also in the United States, although many educators and political leaders have attempted to eradicate performance disparities linked to a child’s background, the gap between fourth-
National Standards
International comparisons as well as disparities within the United States led to passage of the No Child Left Behind Act (NCLB) of 2001, a federal law promoting high national standards for public schools. One controversial aspect of the law is that it requires frequent testing to measure whether standards are being met. Low-
Most people agree with the NCLB goals (accountability and higher achievement) but not with the strategies that must be used (Frey et al., 2012). NCLB troubles those who value the arts, social studies, or physical education because those subjects are often squeezed out when reading and math achievement are the ultimate priorities (Dee et al., 2013). States have been granted substantial power of implementation. Teacher evaluation and preparation has increased, but class size has not decreased, and the tests, and testing, remain controversial (Frey et al., 2012; Dee et al., 2013).
For decades, federally sponsored tests called the National Assessment of Educational Progress (NAEP) have measured achievement in reading, mathematics, and other subjects. Many critics believe that the NAEP is more realistic than state tests because the NAEP labels fewer children proficient. For example in the state of New York, state tests found 62 percent proficient in math, but the NAEP found only 32 percent; 51 percent were found proficient in reading on the state tests but only 35 percent according to NAEP (Martin, 2014).
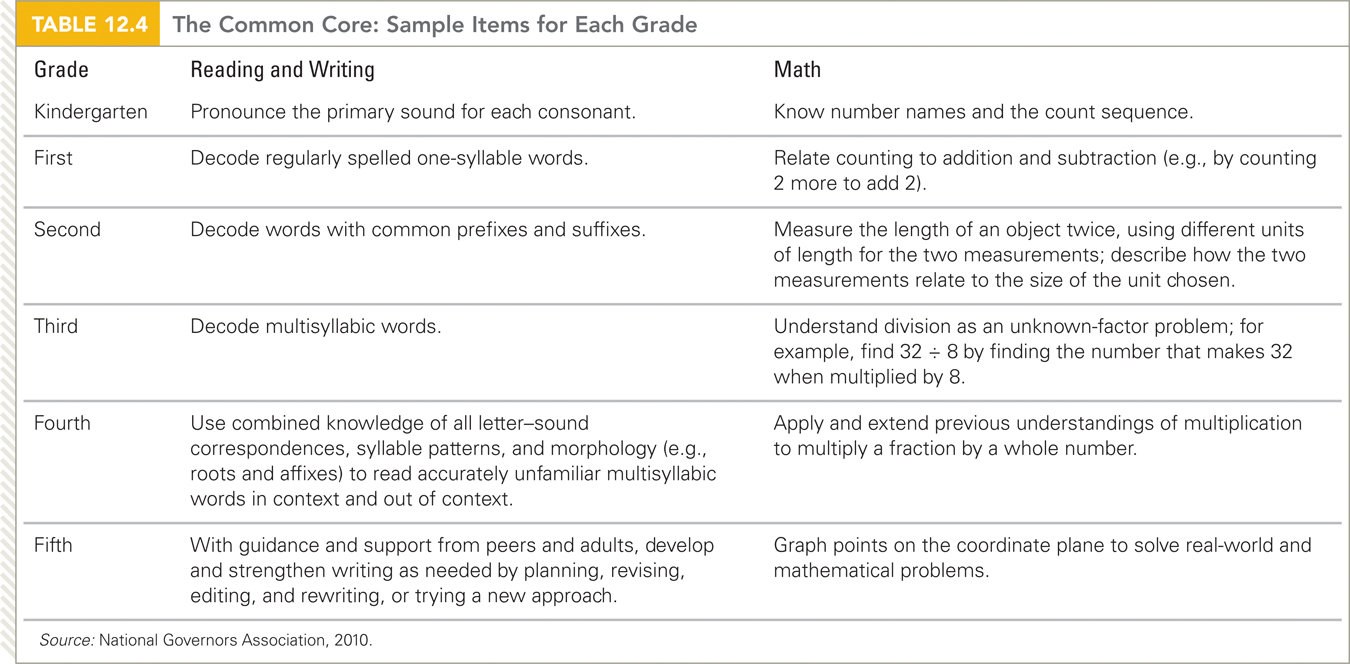
Disagreement about state tests and standards led the governors of all 50 states to designate a group of experts who developed a Common Core of standards, finalized in 2010, for use nationwide. The standards, more rigorous than most state standards, are quite explicit, with half a dozen or more specific expectations for achievement in each subject for each grade. (Table 12.4 provides a sample of the specific standards.) As of 2013, forty-
Most teachers were initially in favor of the Common Core, but implementation has turned many against it. In 2013, a poll by Education Next found only 12 percent of teachers were opposed to the Common Core; a year later, 40 percent were (Gewertz, 2014). Likewise, many state legislators as well as the general public have doubts about the Common Core. This is another example of a general finding: Issues regarding how best to teach children, and what they need to learn, are controversial among teachers, parents, and political leaders.
400
Learning a Second Language
One example of such a controversy involves determining when, how, to whom, and whether schools should provide second-
In the United States, less than 5 percent of children under age 11 study a language other than English in school (Robelen, 2011). (In secondary school, most U.S. students take a year or two of a language other than English, but studies of brain maturation suggest that this is too late for efficient language learning.)
Some U.S. educators note that almost every child studies two languages by age 10 in Canada as well as in most nations of Europe. African children who are talented and fortunate enough to reach high school often speak three languages. The implications of this for U.S. language instruction are often ignored because of debates about immigration and globalization. Instead of trying to teach English-
Choices and Complications
An underlying issue for almost any national or international school is the proper role of parents. In most nations, matters regarding public education—
401
In contrast to that model, local districts in the United States provide most of the funds and guidelines, and parents, as voters and volunteers, are often active in their child’s school. As part of the trend toward fewer children per family, parents are increasingly ready to move their children from one public school to another. Parents befriend their child’s teacher, join parent–
Although most U.S. parents send their children to the nearest public school, almost one-
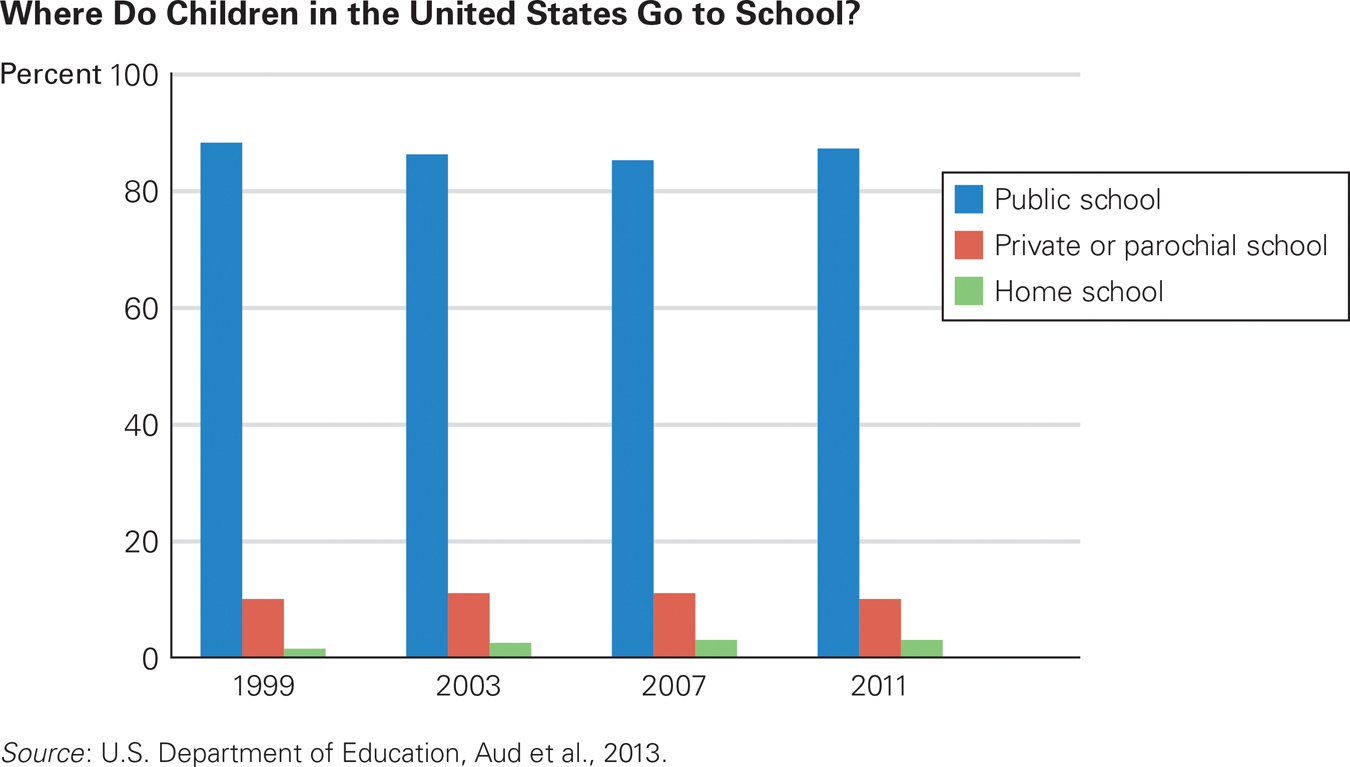
Where’d You Go to School? You can see that home schooling is still the least-
The existence of all of these options creates a problem: It is difficult for parents to decide the best school for their child, partly because neither the test scores of students in any of these schools, nor the moral values a particular school may espouse, correlate with the cognitive skills that developmentalists seek to foster (Finn et al., 2014). Thus, parents may choose a school that may not actually be the best educational experience for their child. Schools that enroll only children from selected families may publish high scores, but not because of the school.
Charter Schools
Charter schools are public schools funded and licensed by states or local districts. Typically, they also have private money and sponsors. They are exempt from some regulations, especially those negotiated by teacher unions (hours, class size, etc.), and they control admissions and expulsions. They are more ethnically segregated and enroll fewer children with special needs (Stern et al., 2014).
On average, teachers at charter schools are younger and work longer hours than regular public school teachers, and school size is smaller than in traditional schools. Perhaps 4 percent of U.S. children are in charter schools.
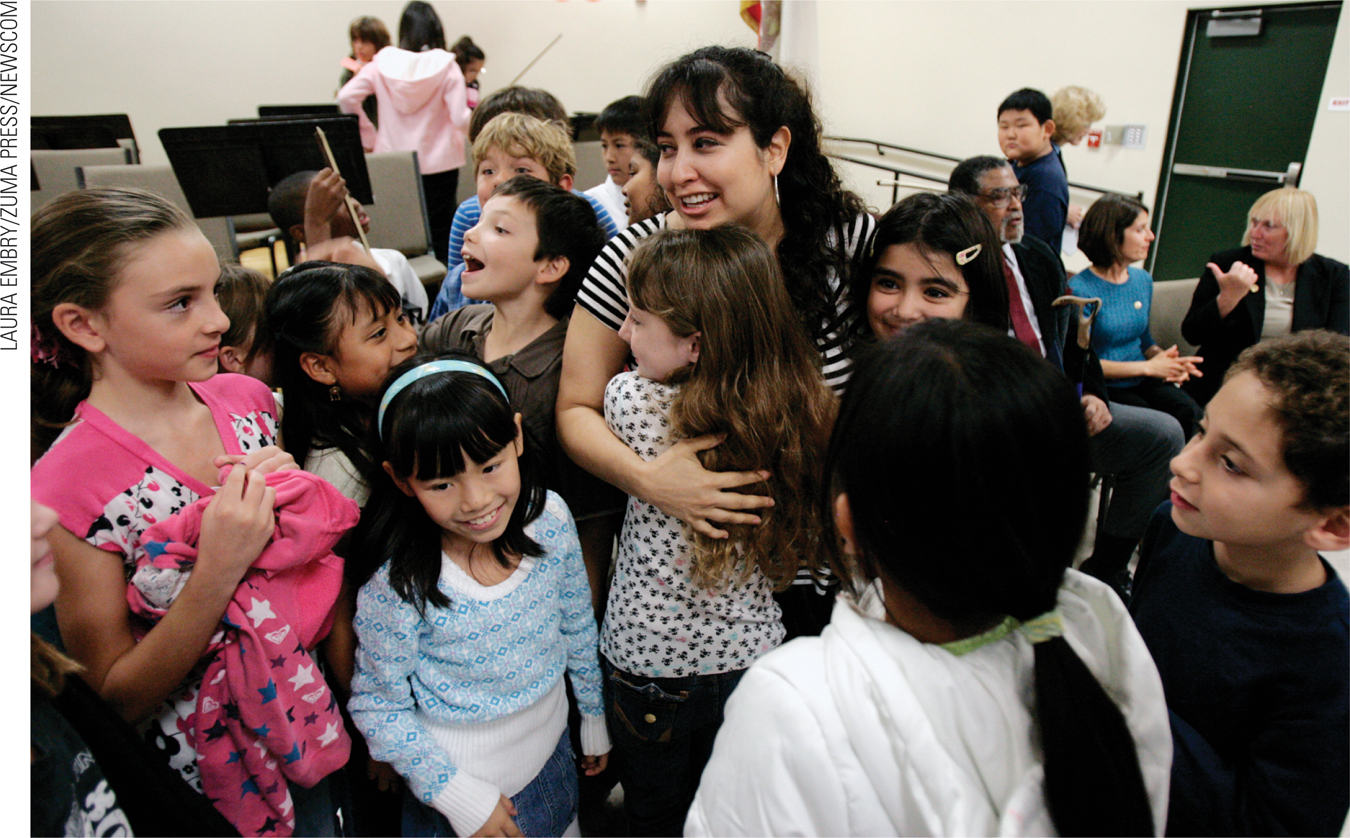
OBSERVATION QUIZ The photo above shows Marissa’s students congratulating their teacher. What do you see in the hidden curriculum?
All the closest students are girls. What have the boys learned that is not part of the official curriculum?
Some charter schools are remarkably successful; others are not (Clark et al., 2014). A major criticism is that not every child who enters a charter school stays to graduate; one scholar reports that “the dropout rate for African American males is shocking” (Miron, quoted in Zehr, 2011b, p. 1). Children and teachers leave charter schools more often than they leave regular public schools, a disturbing statistic.
402
Overall, the charter school question is complex, with so much variation from state to state, and school to school (some schools sought by many parents, some avoided for good reasons) that it is difficult to judge charters as a group.
Private Schools
Private schools are funded by tuition, endowments, and church sponsors. Traditionally in the United States, most private schools were parochial (church related), organized by the Catholic Church to teach religion and to resist the anti-
Recently, many Catholic schools have closed, and other church-
To solve that problem, some U.S. jurisdictions issue vouchers, money that parents can use to pay some or all of the tuition at a private school, including a church-
Home Schools
Home schooling occurs when parents avoid both public and private schools by educating their children at home. In most U.S. states, authorities set standards for what a child must learn, but home-
The major problem with home schooling is not academic (some mothers are conscientious teachers and some home-
How to Decide?
The underlying problem with all these options is that people disagree about the best education for a 6-
Especially for School Administrators Children who wear uniforms in school tend to score higher on reading tests. Why?
The relationship reflects correlation, not causation. Wearing uniforms is more common when the culture of the school emphasizes achievement and study, with strict discipline in class and a policy of expelling disruptive students.
403
Mixed evidence comes from nations where children score high on international tests. Sometimes they have large student–
Who should decide what children should learn and how? Every developmental theory can lead to suggestions about education, but implementation is difficult. Statistical analysis raises questions about homeschooling and about charter schools (Lubienski et al., 2013; Finn et al., 2014), but as our discussion of NAEP, Common Core, TIMSS, and so on makes clear, the evidence allows many interpretations. As one review notes, “the modern day, home-
A Word on Ethnic Diversity
OBSERVATION QUIZ Why is the earlier data reported every few years, and the later years every year?
Every year is needed to show recent trends. As you see, there was less yearly change before 2000. Note also that these numbers are percentages of children of various backgrounds. The absolute numbers have increased in every group.
As of 2014 in the United States, the nation’s public schools are said to have become “majority minority,” which means that most students are from groups that once were called minorities—
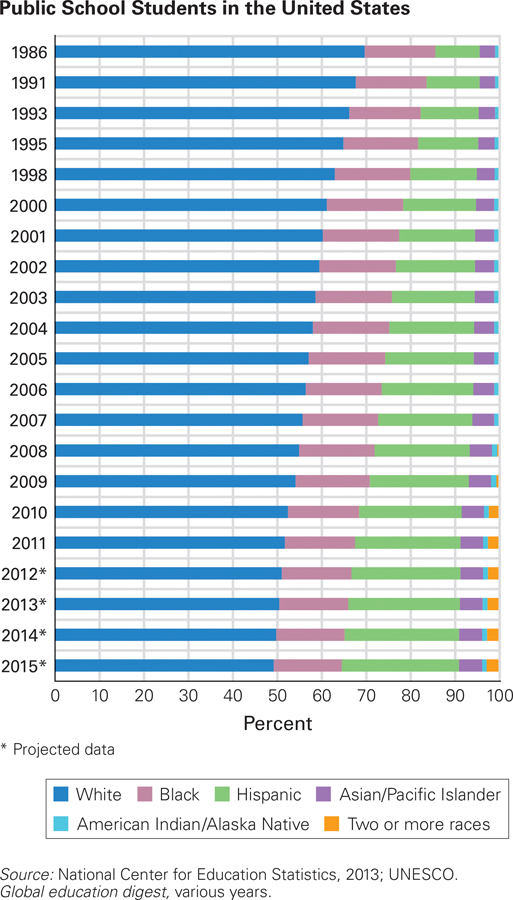
Opportunity Increasing As you know, each ethnic group measured by U.S. statistics is much more diverse than the broad categories shown here. On this chart, the “white” category may be particularly misleading, since children with heritage from Siberia, Baghdad, Dublin, and Oslo are all in that category, despite many religious and cultural differences among them. The two most numerous white categories are children of German or English heritage, but some of their ancestors arrived on the Mayflower and some by jet, with the largest wave coming by steerage between 1870 to 1930. Arrival date and circumstances affect each family. Nonetheless, crude as it is, this chart shows increasing intellectual opportunity: Cognitive growth occurs when people from diverse backgrounds listen to each other.
_________
As you remember from Chapter 1, “race” is a questionable category. In the United States, Hispanic people are of any race, but all are Latino with heritage from Mexico or farther south. Some of them speak only English and have lived in the United States for generations. The category “two or more races” was not offered until recently. Therefore it has not increased as much as it seems to have, since biracial students were considered to be of one race before 2008. This chart shows public school students only, but since 90 percent of U.S. students are in public schools, and since overt racial discrimination is illegal, the addition of private school students would not change the totals significantly.
404
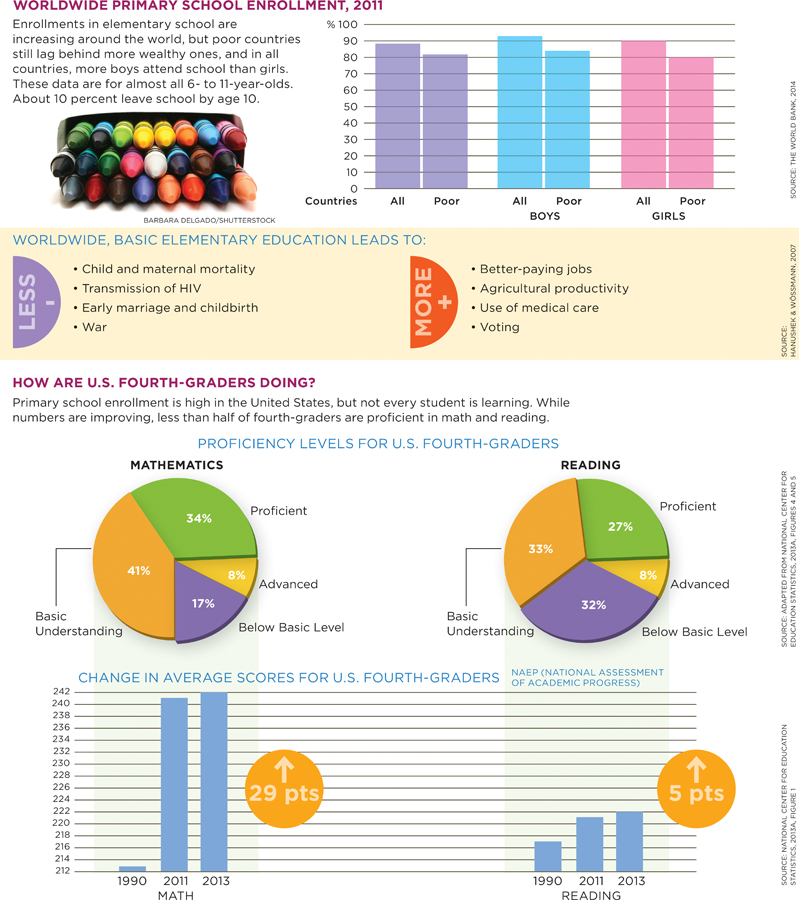
VISUALIZING DEVELOPMENT
Education In Middle Childhood Around The World
Only a decade ago, gender differences in education around the world were stark, with far fewer girls in school than boys. Now girls have almost caught up. However, many of today’s children suffer from past educational inequality: Recent data find that the best predictor of childhood health and learning is an educated mother.
405
Cognitive research leaves no doubt that, barring severe impairment, all school-
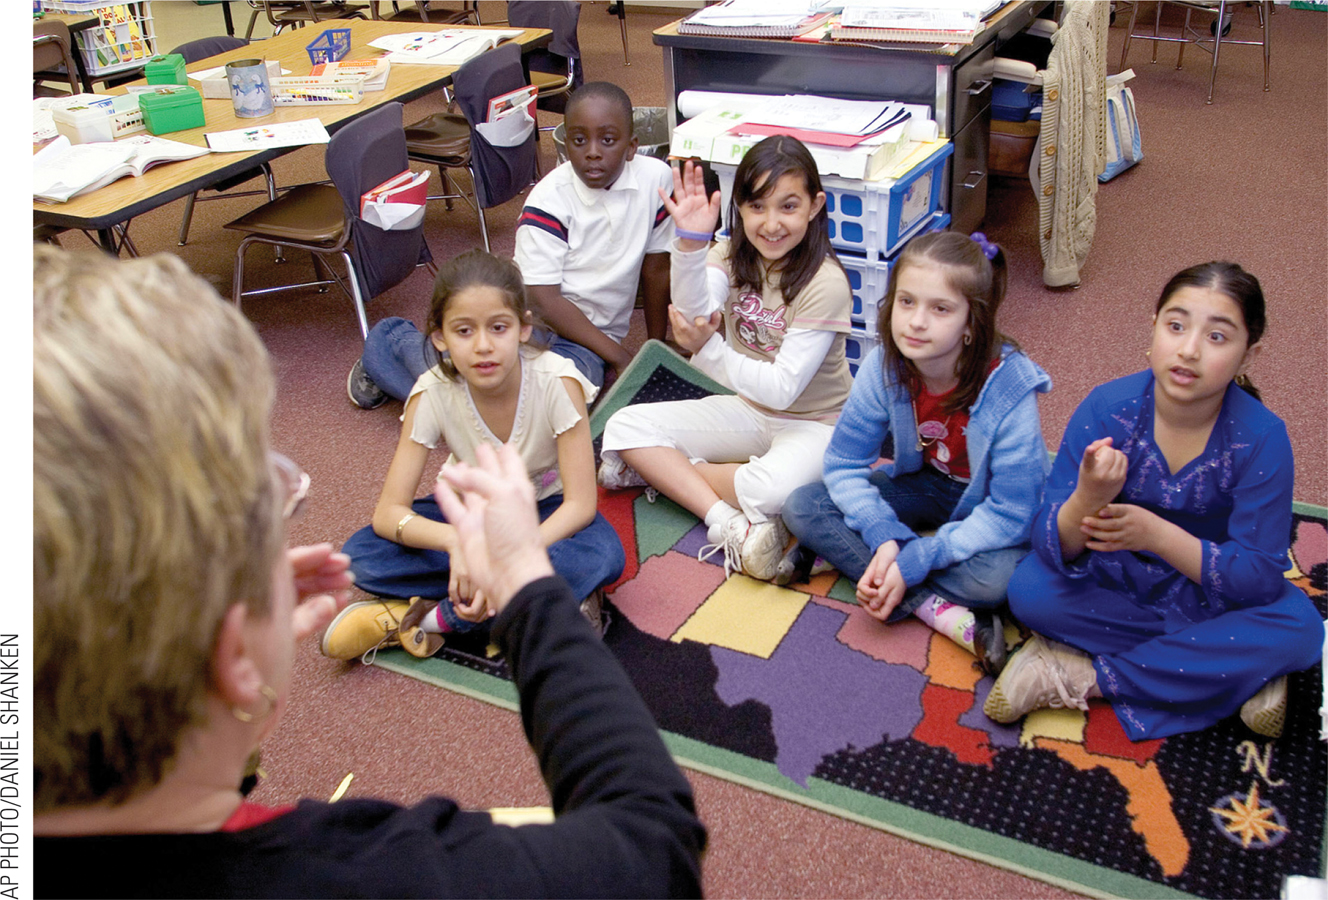
Children also learn best from personal contact, as might be expected during the period of concrete operational thinking. If well taught during middle childhood, children can learn about various groups, becoming sensitive to prejudice against any of their peers—
School children’s ability to be logical and teachable, now that they are no longer preoperational and egocentric, makes this a good time to teach them to be proud of who they are, as well as to learn about their classmates. Ideally, they are fortunate enough to have a diverse classroom and a teacher who appreciates differences and similarities. Schools and homes both have a marked impact on what a child learns, and, as this chapter details again and again, children are ready to learn whatever their social context teaches them.
SUMMING UP Societies throughout the world recognize that school-
WHAT HAVE YOU LEARNED?
Question 12.16
LKVriW0l7tBrjhHQSVgQD4WFejJ7ZYN3YRzlcQhpIwkPCmrjZZdCr712t5F0Zk/C+fCwsr9KSEoOjSWNJRzuofe6ACuIO0HQncx4lOh3Nfk=Worldwide, children are given new responsibility and instruction in middle childhood because that is when the human body and brain are ready.Question 12.17
XEXv1Y9wlR4f5RlAnHwL/N5HrY/R37qMDVbXqY0ddTtIU1Pw7J32xZOUWHaBXb5fORjS/Cu+7mC1Fha66IjIJD89PfhII8drYEcKFA==The stated curriculum comes from the textbook. The hidden curriculum is what happens during the transmission of knowledge and may be a largely unconscious process. The hidden curriculum contains implicit values and assumptions evident in course selection, schedules, tracking, teacher characteristics, discipline, teaching methods, sports competition, student government, and the extracurricular activities offered.Question 12.18
97NFGc8RLjlAEZEZYKhnJ1rmfU6GnlBHYMwCkODRcUY/3E1D6MuLcncdXjzsluLimS2usMD1jy7XQ4lv7XdOHjyIGgrBH9uFrm7eihC6sBY=Children for whom English is a second language are taught in one of three ways. They may learn by immersion, in which all instruction is given in the “new” language. This is the traditional U.S. method for children who do not already speak English. Children also may be taught in their first language until the second language can be taught as a “foreign” tongue. This strategy is rare in the United States. A third option is to have students learn in a bilingual classroom where instruction is given in the native language as well as the “new” language.Question 12.19
EWmEK2v0CrQbbQ5aI6R9pDWtiGDsRVLDunw9iS6+1lPMsu8fZD1K7A==The Trends in Math and Science Study (TIMSS) is an international assessment of the math and science skills of fourth–and eighth– graders. The TIMSS is an actual skill assessment. Although its results are useful, different countries' scores are not always comparable because sample selection, test administration, and content validity are hard to standardize. The Progress in International Reading Literacy Study (PIRLS) is a planned five– year longitudinal study of trends for fourth– grade readers. Question 12.20
lCnMtXO5NILCBMki3cMga2rDTRGe6gfMjsley9CEgr8tKM/+XJCS+VO9mKQ4HzfJUmCJKY0lOoGSFTst8HHvyvIOT42UudxGBGH5/2IgXPSUhe7gLcOZqDs/NxitLUFLIn addition to marked national, ethnic, and economic differences, gender differences in achievement scores are reported. The PIRLS finds girls ahead of boys in verbal skills in every nation by an average of 16 points. The female advantage is not that high in the United States, with the 2011 PIRLS finding girls 10 points ahead. This meant that they were about 2 percent ahead of the average boy, an advantage—similar to Canada, Germany, and the Netherlands— suggesting that those nations are closer in gender equality than the average PIRLS nation. Traditionally, boys were ahead of girls in math and science. However, the 2011 TIMSS reported that gender differences among fourth– graders in math have narrowed or disappeared. In most nations, boys are still slightly ahead, with the United States showing the greatest male advantage (9 points). However in many nations, girls are ahead, sometimes by a great deal, such as 14 points in Thailand and 35 points in Kuwait.
Unlike test results, classroom performance during elementary school shows gender differences in almost every nation. Girls have higher report card grades overall, including in math and science. Then, at puberty, girls' grades dip, especially in science, and in college, fewer women choose STEM (Science, Technology, Engineering, Math) majors, and even fewer pursue STEM careers.Question 12.21
SmHIROmhbOwcZ6pWW8Sr2HONK3zt7IZO8Ukfuxfc4Th8uBQxBN+ClCVN+pgimwenxduoEDLGmGKF5AVQlc0gNA==The Common Core standards were created to establish rigorous standards and appropriate assessments to meet the No Child Left Behind Act guidelines. These standards are very specific and precise; students either meet them or not.Question 12.22
uelt269VmzeIJ10J591L2g5+b5DtXB7Ly3Wf6jcK8jyeJJ2Ty+lAhXgdQQfXWCeHvydmH0G6zkbpyq4Wa7w6ifFsXZqwY604Charter schools are public schools with additional funding from private sources. They control student admission and expulsion and often have some exemptions from state regulations. Private schools are funded by tuition from families as well as private sources and can be religious or secular in nature. Home schooling is when parents educate their own children at home.
406