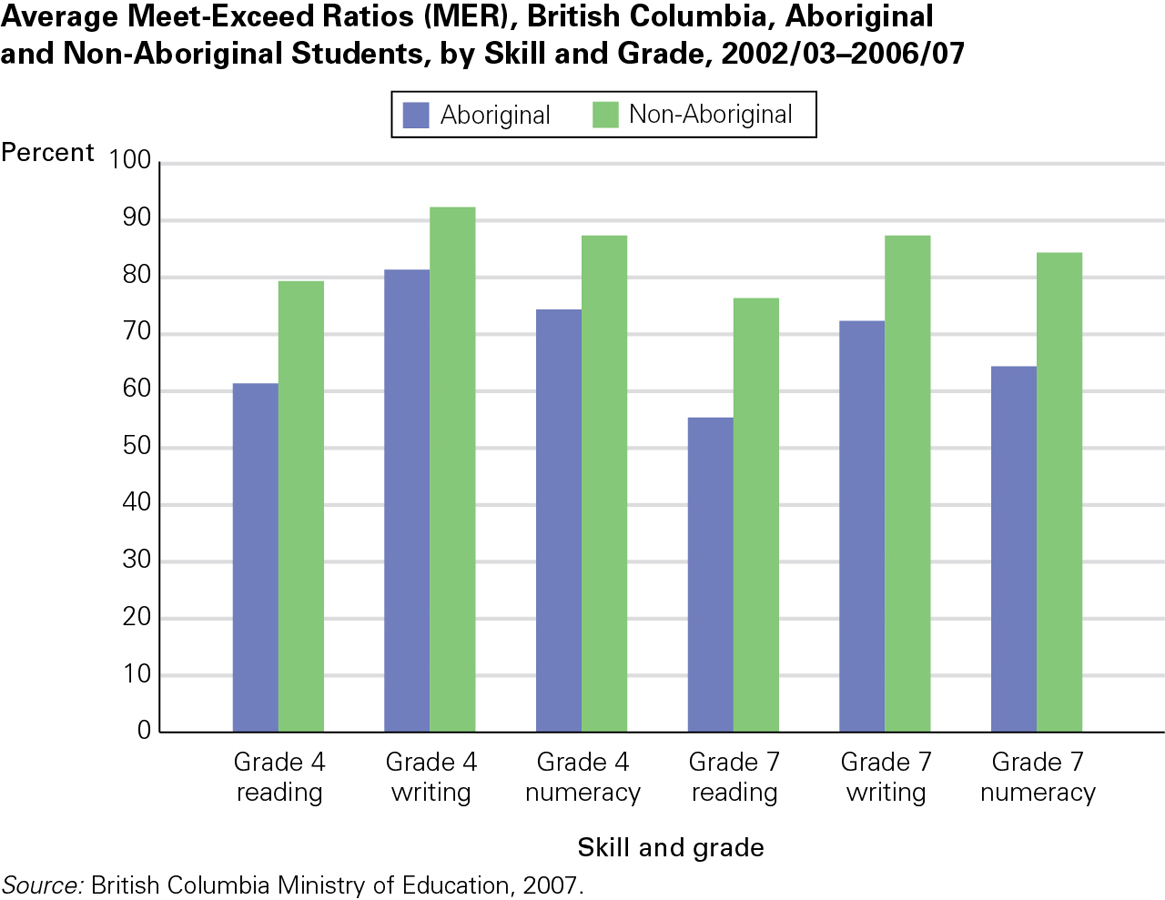
FIGURE 8.3 Why Have Aboriginal Students Fallen Behind? This graph clearly illustrates what experts call “the Aboriginal education gap.” It shows meet-exceed ratios for Aboriginal and non-Aboriginal students in British Columbia primary schools between 2002 and 2007. (Meet-exceed ratios are a commonly used summary statistic for standardized test scores). In each of the three tested areas, Aboriginal students lagged well behind their peers.