1.4 Using the Scientific Method
There are hundreds of ways to design scientific studies and analyze their results, and researchers continually try to make sure that their data are valid and convincing. Often statistical measures help scientists discover relationships between various aspects of the data. (Some statistical perspectives are presented in TABLE 1.6.) Every research design, method, and statistical measure has strengths as well as weaknesses. Now we describe three basic types of research designs—
| Measure | Use |
|---|---|
| Effect size | Indicates how much one variable affects another. Effect size ranges from 0 to 1: An effect size of 0.2 is called small, 0.5 moderate, and 0.8 large. |
| Significance | Indicates whether the results might have occurred by chance. A finding that chance would produce the results only 5 times in 100 is significant at the 0.05 level. A finding that chance would produce the results once in 100 times is significant at 0.01; once in 1000 times is significant at 0.001. |
| Cost benefit analysis | Calculates how much a particular independent variable costs versus how much it saves. This is particularly useful for analyzing public spending. For instance, one cost- |
| Odds ratio | Indicates how a particular variable compares to a standard, set at 1. For example, one study found that the odds ratio of Canadian university students finding employment related to their field of study is 5.267 for those in health sciences, 2.018 for those in education, and 1.951 for those in mathematics/computer/information sciences (Boudarbat & Chernoff, 2009). |
| Factor analysis | Hundreds of variables could affect any given behaviour. In addition, many variables (such as family income and parental education) may overlap. To take this into account, analysis reveals variables that can be clustered together to form a factor, which is a composite of many variables. For example, SES might become one factor, child personality another. |
| Meta- |
A “study of studies.” Researchers use statistical tools to synthesize the results of previous, separate studies. Then they analyze the accumulated results, using criteria that weight each study fairly. This approach improves data analysis by combining the results of studies that were too small, or too narrow, to lead to solid conclusions. |
| Sources: Alasuutari et al., 2008; Duncan & Magnuson, 2007; Hubbard & Lindsay, 2008. | |
Who Participates? For all these measures, the characteristics of the people who participate in the study (formerly called subjects, now called participants) are important, as is the number of people who are studied.
Observation
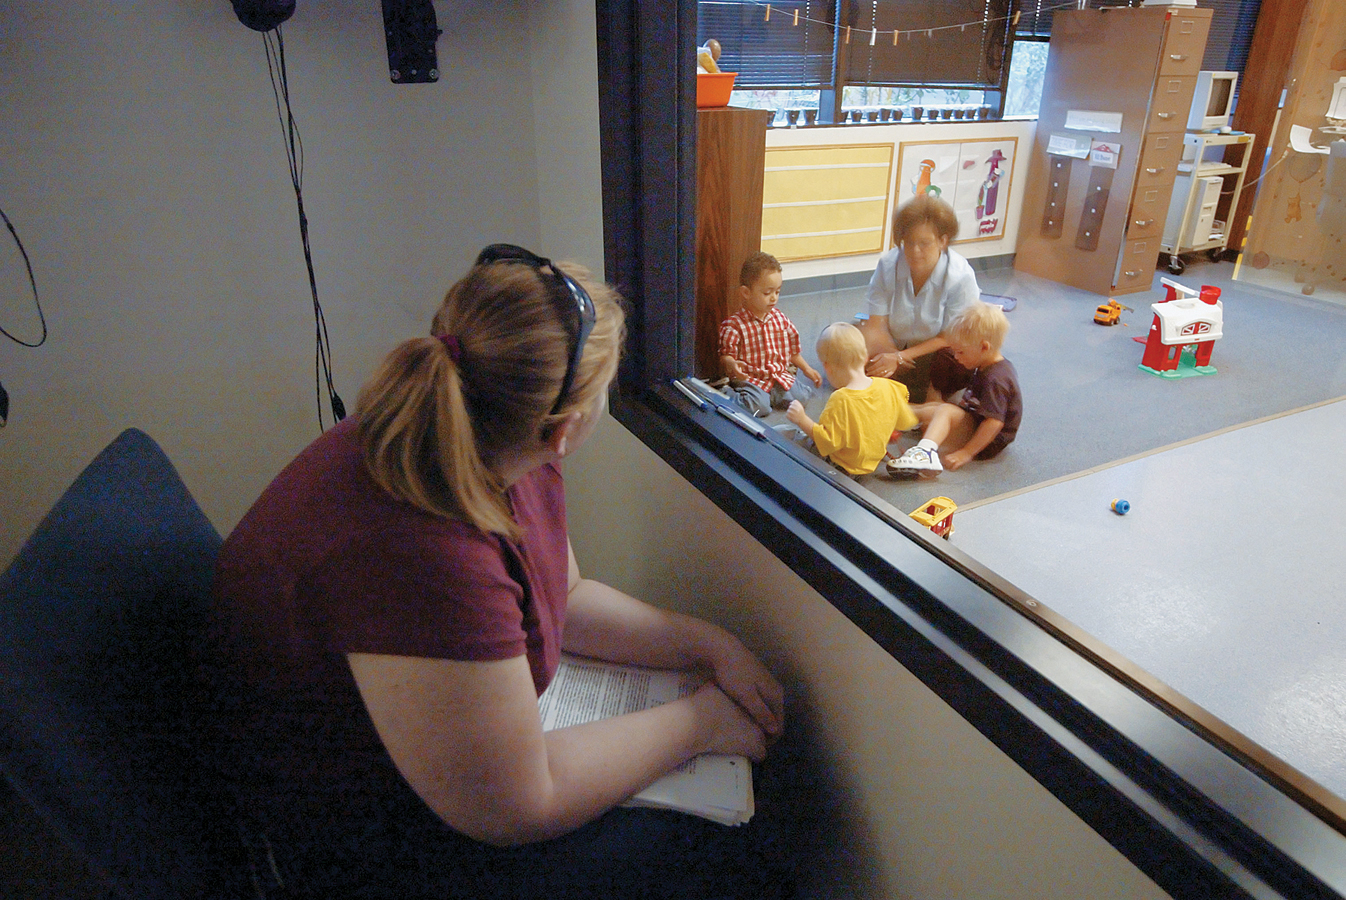
Scientific observation requires researchers to record behaviour systematically and objectively. Observations often occur in a naturalistic setting (such as a home, school, or public park), where people behave as they usually do and ideally where the observer can be ignored or go unnoticed. Scientific observation can also occur in a laboratory, where scientists record human reactions in various situations, often with wall-
Observation is crucial in developing hypotheses, as Beal did when she wanted to understand what caused sudden infant death syndrome. However, observation provides issues to explore, not proof. For SIDS, observed differences between Chinese and Australian infants included prenatal care, maternal diet, parental age, breastfeeding, facial features, baby blanket fabrics, and more. Beal’s hypothesis that the crucial difference was sleeping position needed an experiment.
35
The Experiment
The experiment is the usual research method used to establish what causes what. In the social sciences, experimenters typically impose a particular treatment on a group of volunteer participants (formerly referred to as subjects) or expose them to a specific condition and then note whether their behaviour changes.
In technical terms, the experimenters manipulate an independent variable, which is the imposed treatment or special condition (also called the experimental variable; a variable is anything that can vary). They note whether this independent variable affects whatever they are studying, called the dependent variable (which depends on the independent variable).
Thus, the independent variable is the new, special treatment; any change in the dependent variable is the result. In Beal’s research, convincing some European-
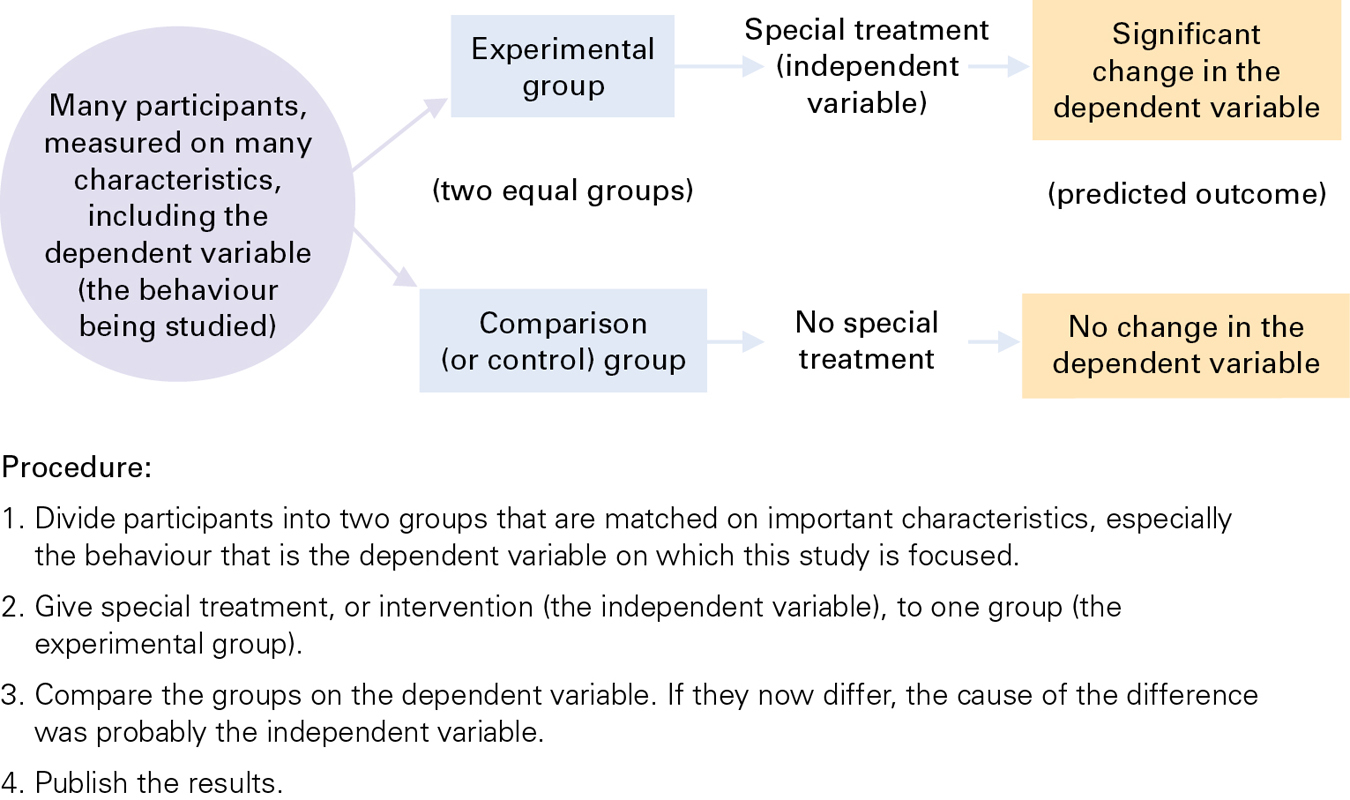
The purpose of an experiment is to find out whether an independent variable affects the dependent variable. In a typical experiment (as diagrammed in Figure 1.12), two groups of participants are studied. One group is called the experimental group, which gets a particular treatment (the independent variable). The other group is the comparison group (also called the control group), which does not. When the scores, or results, of the experimental group and control group are significantly different, based on statistical analysis, then we know that the particular treatment was effective, for better or worse.
36
ESPECIALLY FOR Nurses In the field of medicine, why are experiments conducted to test new drugs and treatments? ![]()
Another example of an experiment in this chapter was the study involving 11-
The Survey
A third research method is the survey. Information is collected from a large number of people by interview, questionnaire, or some other means. This is a quick, direct way to obtain data.
Unfortunately, although surveys may be quick and direct, they are not necessarily accurate. When pollsters try to predict elections, they survey thousands of potential voters. They hope that the people they survey will vote as they say they will, that undecided people will follow the trends, and that people who refuse to tell their opinion, or who are not included, will be similar to those surveyed. None of this is certain. Some people lie, some change their minds, some (especially those who don’t have phones or who never talk to strangers) are never counted.
Also, survey answers are influenced by the wording and the sequence of the questions. For example, class evaluations of professors and the courses they teach are used at many universities and colleges. One could imagine that if students found a certain professor charismatic and funny, the positive ratings for that professor would be higher if students were asked “Was the professor able to engage with the students?” instead of “Was the professor well organized?” Course ratings might also be higher if the questions about the professor came first, followed by those about the course content and structure, since the students’ good feelings for the professor would carry over to the course itself.
Another factor that affects survey results is that respondents present themselves as they would like to be perceived. For example, a survey done for CBC News in 2011 asked Canadians if they believed they were overweight. About 44 percent said they were overweight, 7 percent admitted to being obese, and 43 percent stated that they were at a healthy weight. According to Dr. Arya Sharma, obesity management professor at the University of Alberta, two-
37
To understand responses in more depth, another method can be used—
Even if accurate, the case study applies only to one person, who may be quite unlike other people. For instance, the report on David is a case study, but David is unique: Other embryos exposed to rubella may have quite different lives than David’s.
Studying Development over the Life Span
In addition to conducting observations, experiments, and surveys, developmentalists must measure how people change or remain the same over time, as our definition of the science of human development stressed. Remember that systems are dynamic, ever-
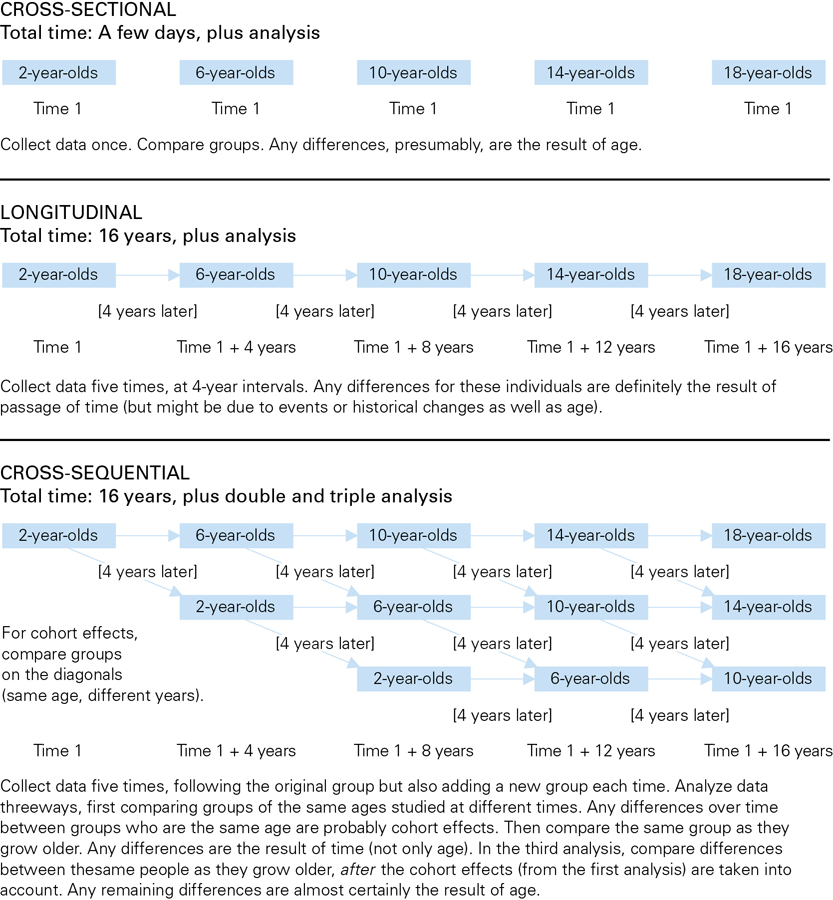
Cross-
Cross-

CATHY WALSH
38
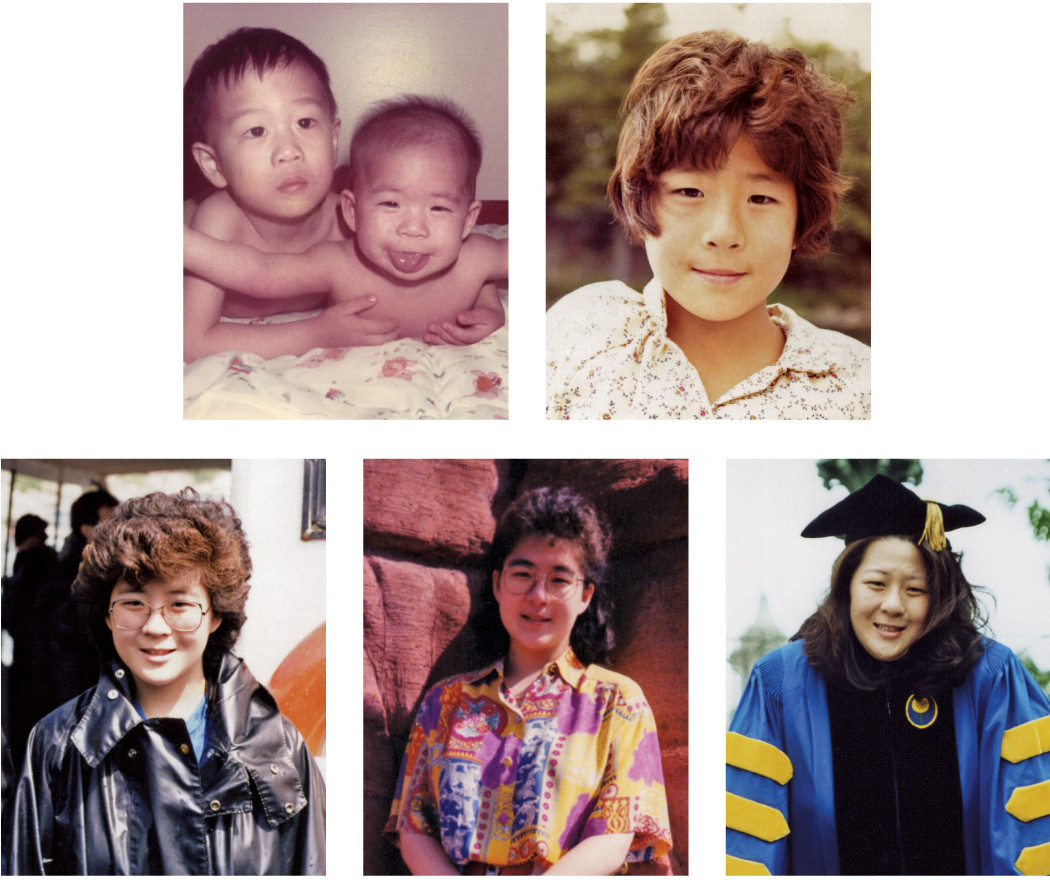
Longitudinal ResearchTo help discover whether age itself rather than cohort or economic differences causes a developmental change, scientists undertake longitudinal research. This requires collecting data repeatedly on the same individuals as they age. Longitudinal research is particularly useful in tracing development over many years (Elder & Shanahan, 2006).
For example, in 1994 two agencies of the Canadian government began collaborating on the National Longitudinal Survey of Children and Youth (NLSCY). About 25 000 children were questioned every two years until they reached adulthood. The objective of the NLSCY was to gather information about the critical factors affecting child development in Canada, and then to use this information for policy analysis and program development.
The data collected by the NLSCY has also been very useful for developmental researchers in Canadian universities. As an example, with the wealth of information gathered over time, one group of researchers was able to explore the effects of maternal depression on emotional disorders in adolescents (Naicker et al., 2012). Based on survey responses of more than 900 children, their findings revealed that adolescents who were initially exposed to their mothers’ depression between the ages of 2 and 5 were twice as likely to experience some form of emotional disorder than children who were not exposed to maternal depression at this age. However, those exposed to maternal depression in the first postpartum year or after the age of 5 were not significantly affected. This discovery allowed the research team to conclude that there is a sensitive period for initial exposure to maternal depression that may negatively affect children’s mental health many years later.
ESPECIALLY FOR Future Researchers What is the best method for collecting data? ![]()
It is important to note, however, that longitudinal research has several drawbacks. Over time, participants may withdraw, move to an unknown address, or die. These losses can skew the final results if those who disappear are unlike those who stay, as they usually are. Another problem is that participants become increasingly aware of the questions or the goals of the study and that awareness may cause them to change in ways that differ from most other people.
Probably the biggest problem comes from the historical context. Science, popular culture, and politics alter life experiences, and those changes limit the current relevance of data collected on people born decades ago. Results from longitudinal studies of people born in 1900, as they made their way through childhood, adulthood, and old age, may not be relevant to people born in 2000. Regarding male employment, voluntary retirement before age 60 has been less common over the past decade not because people have changed but because the exosystem has.
39
Furthermore, longitudinal research requires years of data. For example, alarm about possible future harm caused by ingesting phthalates (chemicals used in manufacturing) in plastic baby bottles and infant toys leads many parents to use glass baby bottles. But perhaps the risk of occasional shattered glass causes more harm than the chemicals in plastic, or perhaps the mother’s use of cosmetics, which puts phthalates in breast milk, is a much greater source of the chemicals than any bottles (Wittassek et al., 2011). Could breastfeeding harm infants? The benefits of breast milk probably outweigh the dangers, but we want answers now, not in decades.
Cross-
A cross-
One well-
Some more recent cross-
40
KEY points
- Scientists use many methods because none is perfect.
- Careful and systematic observation can discover phenomena that were unnoticed before.
- Experiments uncover what causes what; specifically, how the independent variable affects the dependent variable.
- Surveys are quick, and case studies are detailed, but both are vulnerable to bias.
- To study change over time, cross-
sectional, longitudinal, and cross- sequential designs are used, each with advantages and disadvantages.
41