Harm to Children
We have saved for the end of this chapter the most disturbing topic: child maltreatment. The assumption thus far has been that adults seek the best for young children and that their disagreements (e.g., what to feed, what kind of preschool, how to discipline) arise from contrasting theories about how best to foster happy and healthy children.
However, sometimes parents angrily harm their own offspring and other adults do not protect children. When a child is officially deemed abused or neglected, almost always (90 percent of the time) the perpetrator was the child’s biological parent (U.S. Department of Health and Human Services, January 15, 2015).
Parents are not the only ones to blame. The food, air, play space, and medical care that all children need is not always available, in part because communities and governments have other priorities. Often preventive and protective measures that could stop injuries, abuse, or other forms of harm are missing. Far more children die from violence—
Protection for Every Child
harm reduction
Reducing the potential negative consequences of behavior, such as safety surfaces replacing cement at a playground.
Overall, an important change in terminology is needed. Instead of using the term accident prevention, public health experts prefer harm reduction. Accident implies that an injury is random, unpredictable; if anyone is at fault, it’s a careless parent or a child. Further, accident usually refers to a sudden, unexpected event. Instead, harm reduction makes it clear that much can be done long before an injury or illness occurs to reduce the damage from any hazard.
226
Many community practices and national policies to reduce harm have already been mentioned. Among them are measures to ensure adequate nutrition, oral health, safe play spaces, preventive immunization, and quality preschools.
There is neither time nor space to explore all the other ways young children may be harmed by social neglect of their needs. We present only two examples, motor-
INJURIES FROM CARS AND TRUCKS Worldwide, motor vehicles cause millions of premature deaths among adults as well as children: Not until age 40 does any specific disease overtake cars and trucks as a cause of mortality. Of all the life years lost worldwide, 14 percent are caused by accidents, with motor-
In some nations, malnutrition, malaria, and other infectious diseases cause most infant and child deaths, but even in those nations too many children are killed by cars. India, for example, has one of the highest rates worldwide of child motor-
Why are young children so vulnerable? Some reasons have just been explained. Immaturity of the prefrontal cortex makes young children impulsive; they plunge into danger. Unlike infants, their motor skills allow them to run into the street in a flash, before a watching adult can stop them. Their curiosity is boundless; their impulses uninhibited.
Fatal accidents for young passengers and pedestrians are less common than they were a few decades ago, even though more cars are on the road and more miles are driven. In the United States, in 2012, fewer than 3 preschoolers per 100,000 were killed by motor vehicles compared to almost 12 per 100,000 in 1970. How did this victory occur?

A major reason is mandated child-
227
As more parents took that advice from experts, the data began to confirm that safety seats saved lives. One by one, each of the 50 states has made it illegal to transport a young child not in a secure car seat. Unsafe transportation included a passenger holding the baby, as almost all mothers (including me) once did.
ELIMINATING LEAD Lead was recognized as a poison a century ago (Hamilton, 1914). The symptoms of plumbism, as lead poisoning is called, were obvious—
The lead industry defended the heavy metal. Manufacturers argued that low levels were harmless and blamed parents for letting their children eat flaking chips of lead paint (which tastes sweet).
Lead remained a major ingredient in paint (it speeds drying) and in gasoline (it raises octane) for most of the twentieth century. The fact that babies in lead-
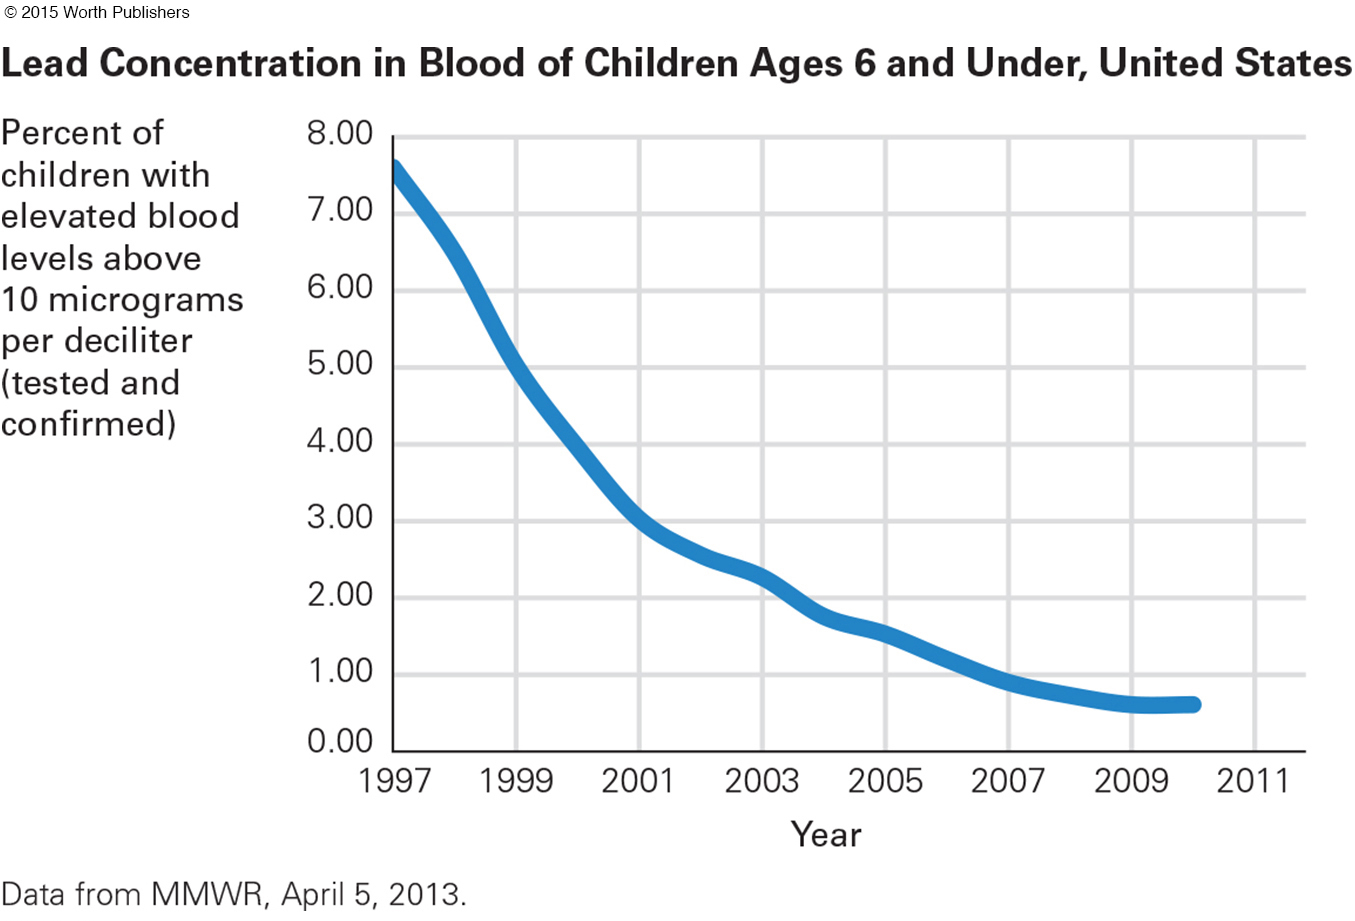
Finally, chemical analysis of blood and teeth, with careful longitudinal and replicated research, proved that lead was indeed a poison for children (Needleman et al., 1990; Needleman & Gatsonis, 1990). The United States banned lead in paint (in 1978) and automobile fuel (in 1996). The blood level that caused plumbism was set at 40 micrograms per deciliter, then 20, then 10. Recently, danger has been thought to begin at 5 micrograms, with no level proven safe (MMWR, April 5, 2013).
Regulation has made a difference: The percentage of U.S. 1-
228
In most areas, pediatricians test infant blood levels, and parents take precautions, such as increasing their children’s calcium intake, wiping window ledges clean, testing drinking water, avoiding lead-
In some states (e.g., Colorado and Wyoming), average lead levels of young children are close to zero. In other states that once had extensive lead-
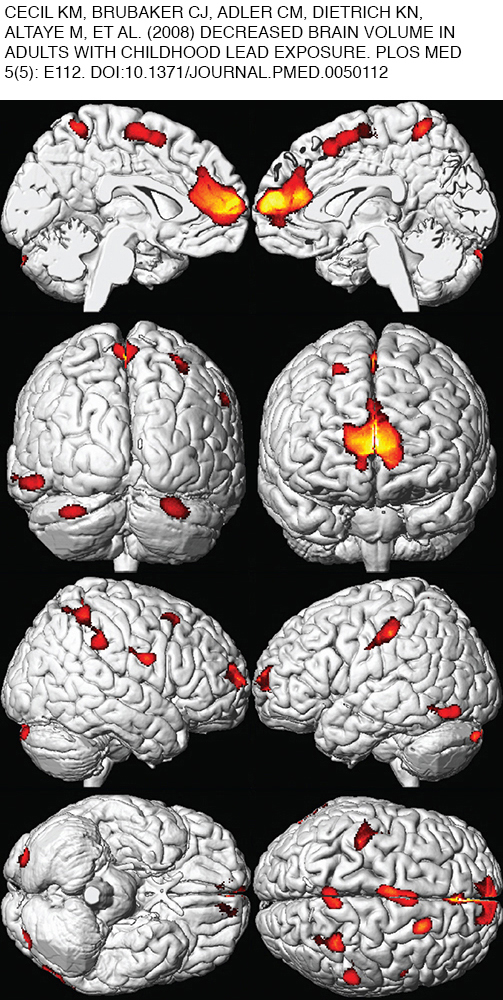
Scientists sometimes use data collected for other reasons to draw new conclusions. This is the case with lead. About 15 years after the sharp decline in blood lead levels in preschool children, the rate of violent crime committed by teenagers and young adults fell sharply. Coincidence? Some scientists decided to test it.
International research was crucial, because the year in which nations passed laws reducing lead varied. The year crime rates plummeted also varied, but generally it occurred about 15 years after the laws reducing lead. The correlation between reduced lead and reduced impulsive crime occurs in every nation that has reliable data on lead and crime—
There is now no doubt that lead harms the brain. Might some of the thousands of new chemicals in the air, water, or soil also cause brain damage? That raises questions about government priorities.
The U.S. government in 2000 planned to follow 100,000 children, beginning before birth, in the National Children’s Study. Various substances in the blood would have been tested. However, that study was reduced, revised, redesigned, and finally canceled at the end of 2014 (Kaiser, 2014). Developmentalists hope that other research will inform us about harmful substances more quickly than the 100 years that elapsed with lead. The U.S. Congress might reinstate the National Children’s Study in 2015.
Child Maltreatment Noticed and Defined
child maltreatment
Intentional harm to or avoidable endangerment of anyone under 18 years of age.
Child maltreatment includes any form of serious harm to a child under age 18, and it includes abuse (deliberate physical or sexual action) and neglect (failure to provide essential physical or emotional care). Although abuse makes headlines, neglect is “the most common and most frequently fatal form of child maltreatment” (Proctor & Dubowitz, 2014, p. 27).
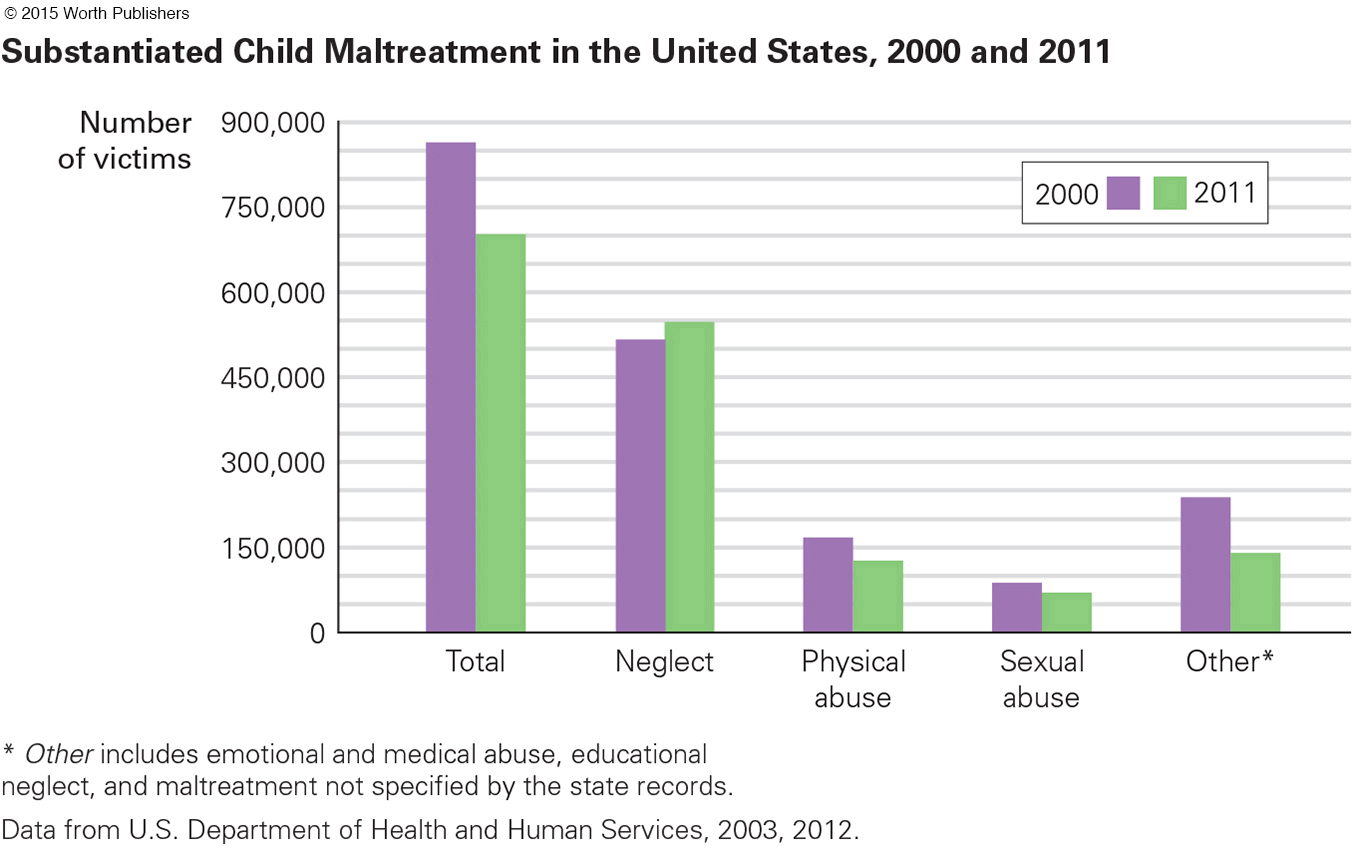
In the United States, of all the substantiated cases of child maltreatment in 2013, 80 percent were neglect, 18 percent physical abuse, 9 percent sexual abuse, and 9 percent emotional abuse. [A few were tallied in two categories (U.S. Department of Health and Human Services, January 15, 2015).]
substantiated maltreatment
Harm or endangerment that has been reported, investigated, and verified.
Substantiated maltreatment means that a case has been reported, investigated, and verified (see Figure 6.4). In 2013, almost 679,000 children suffered substantiated abuse in the United States. Substantiated maltreatment harms about 1 in every 90 children aged 2 to 5 annually.
reported maltreatment
Harm or endangerment about which someone has notified the authorities.
Reported maltreatment means simply that the authorities have been informed. Since 1993, the number of reports per year in the United States has ranged from about 2.7 million to 3.6 million, with 3.5 million (involving more than 6 million children, since often a report is about all the children in a family) in 2013 (U.S. Department of Health and Human Services, January 15, 2015).
229
Question 6.32
OBSERVATION QUIZ
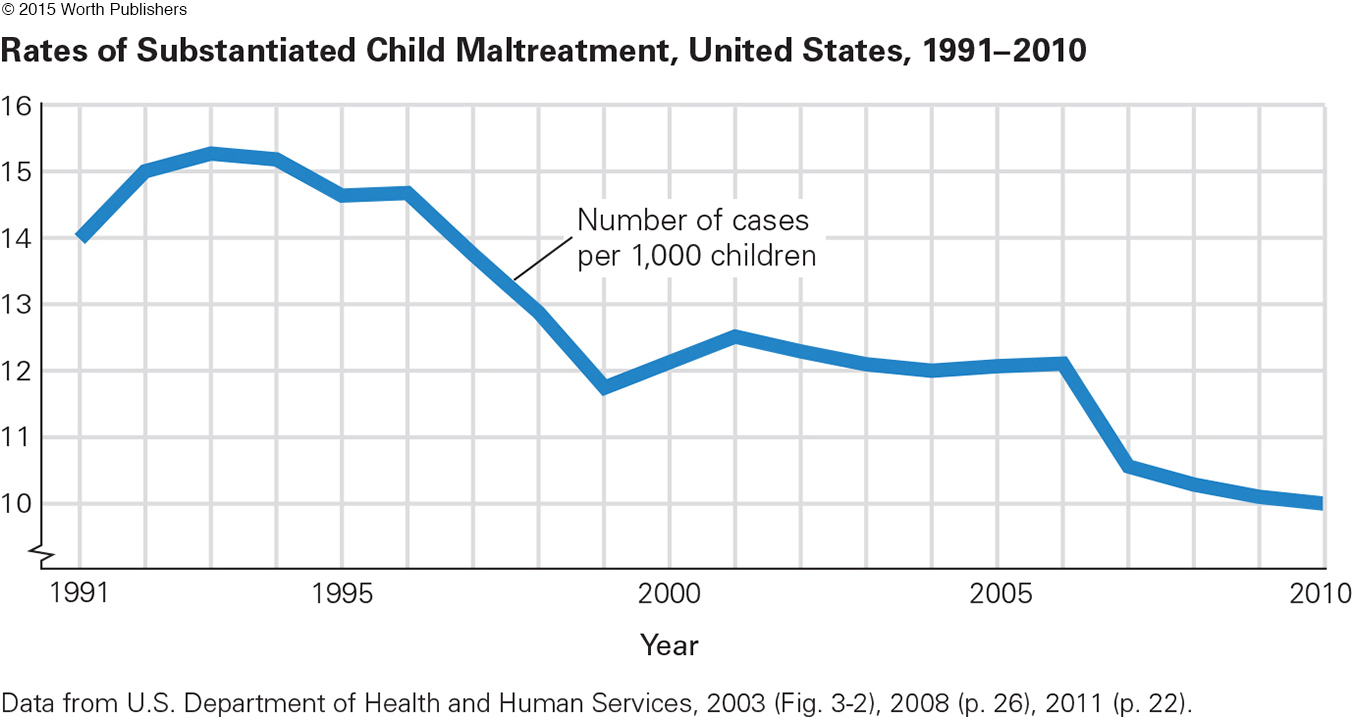
The data point for 2010 is close to the bottom of the graph. Does that mean it is close to zero?
No. The number is actually 10.0 per 1,000. Note the little squiggle on the graph’s vertical axis below the number 10. This means that numbers between 0 and 9 are not shown.
The 5-
Each child is counted only once, so five verified reports about a single child result in one substantiated case.
Substantiation requires proof. Not every investigation finds unmistakable harm or a witness willing to testify. Sometimes reports provide too little information, and the child cannot be located.
Many professionals are mandated reporters, required to report any signs of possible maltreatment, even when they doubt that abuse or neglect occurred. Often investigation finds no harm (Pietrantonio et al., 2013).
Some reports are “screened out,” which means that the agency decides the case does not come under their jurisdiction: Some such cases are referred to the military or a Native American tribe (who have their own systems).
A report may be deliberately false (though less than 1 in 500 are).
Officially, substantiated child maltreatment increased from about 1960 to 1990 and decreased thereafter, and it continued to decrease from 2012 to 2013 (see Figure 6.5). Physical and sexual abuse declined but neglect did not. Other sources also report declines, particularly in sexual abuse, over the past two decades (Finkelhor & Jones, 2012). Perhaps national awareness has led first to more reporting and then to better prevention.
Question 6.33
OBSERVATION QUIZ
Have all types of maltreatment declined since 2000?
Most types of abuse are declining, but not neglect. This kind of maltreatment may be the most harmful because the psychological wounds last for decades.
230
Unfortunately, official reports leave room for doubt. Wide disparities are evident from state to state in number of victims and categories of maltreatment. For example, Pennsylvania reports fewer victims of child maltreatment than Maine (3,260 compared to 3,820 in 2013), but the child population of Pennsylvania is ten times that of Maine. Why?
Disparities are also evident in rates among people of various ethnic backgrounds. For example, compared to European Americans, in Alaska the rate of child maltreatment is a third lower for African Americans but nine times higher for Alaska Natives. Why?
For developmentalists, a particular problem is that maltreatment is most common early in life, when children are too young to ask for help or to be required to go to school (where teachers would notice a problem). In fact, the substantiated maltreatment rate for those age 2 to 6 is 50 percent higher than for those age 6 and older (U.S. Department of Health and Human Services, January 15, 2015). Are many more young children mistreated but not reported?
Often the first sign of maltreatment is delayed development, such as slow growth, immature communication, lack of curiosity, or unusual social interactions. All these difficulties are evident during early childhood or even infancy. Maltreated children may seem fearful, startled by noise, defensive and quick to attack, and confused between fantasy and reality.
posttraumatic stress disorder (PTSD)
An anxiety disorder that develops as a delayed reaction to having experienced or witnessed a shocking or frightening event. Its symptoms may include flashbacks, hypervigilance, anger, nightmares, and sudden terror.
Posttraumatic stress disorder (PTSD) was first identified in combat veterans and then in adults who had experienced some emotional injury or shock (after a serious accident, natural disaster, or violent crime). But the symptoms of maltreated children (as in the previous paragraph) coincide with PTSD. We now believe that some maltreated children suffer from PTSD, with signs of neurological, emotional, and behavioral damage (Neigh et al., 2009; Weiss et al., 2013).
CONSEQUENCES OF MALTREATMENT The immediate harm of maltreatment is obvious, as when a child is bruised, broken, afraid to talk, or failing in school (see Table 6.3 for other signs). However, that is just the beginning. When researchers follow maltreated children over the years, enduring deficits in social skills seem more crippling than physical harm.
Injuries that do not fit an “accidental” explanation, such as bruises on both sides of the face or body; burns with a clear line between burned and unburned skin; “falls” that result in cuts, not scrapes Repeated injuries, especially broken bones not properly tended (visible on X- Fantasy play, with dominant themes of violence or sexual knowledge Slow physical growth, especially with unusual appetite or lack of appetite Ongoing physical complaints, such as stomachaches, headaches, genital pain, sleepiness Reluctance to talk, to play, or to move, especially if development is slow No close friendships; hostility toward others; bullying of smaller children Hypervigilance, with quick, impulsive reactions, such as cringing, startling, or hitting Frequent absence from school Frequent changes of address Turnover in caregivers who pick up child, or caregiver who comes late, seems high Expressions of fear rather than joy on seeing the caregiver |
231
Even if a child was mistreated in the early years and then not after age 5, emotional problems linger (Godinet et al., 2014). The effects (drug abuse, social isolation, poor health) are still evident in adulthood (Sperry & Widom, 2013; Mersky et al., 2013).
Finding and keeping a job is a critical aspect of adult well-
The researchers concluded, “abused and neglected children experience large and enduring economic consequences” (Currie & Widom, 2010, p. 111). In this study, women were more impaired than men: It may be that self-
This study is just one of hundreds of longitudinal studies, all concluding that childhood maltreatment affects people decades after broken bones, frail bodies, or medical neglect disappear. To protect the future health of the entire society, prevention of child maltreatment is crucial.
Three Levels of Prevention
The role of laws in keeping children safe is dramatically highlighted in the data on car seats and blood lead levels. Over the same decades, a much better understanding of prevention has occurred. Social measures, not merely parental love and vigilance, are important.
primary prevention
Actions that change overall background conditions to prevent some unwanted event or circumstance, such as injury, disease, or abuse.
secondary prevention
Actions that avert harm in a high-
tertiary prevention
Actions, such as immediate and effective medical treatment, after an adverse event (such as illness or injury).
We now see three levels of prevention: Primary prevention changes the social context; secondary prevention focuses on high-
FOR CARS AND LEAD For motor-
Secondary prevention reduces danger in high-
Finally, tertiary prevention reduces damage after an accident. Examples include harsh penalties for hit-
The same triad works for every harm. For lead, laws about gasoline were primary prevention, while testing children and keeping them away from renovation of old houses was secondary prevention. Tertiary prevention sometimes meant giving the child drugs to remove the toxic metal from the bloodstream. This is called chelating, which is itself hazardous as well as a sign that prevention should have begun much earlier.
FOR ABUSE AND NEGLECT The ultimate goal with regard to child maltreatment is primary prevention, a social network of customs and supports that make parents, neighbors, and professionals protect every child. Neighborhood stability, parental education, income support, and fewer unwanted children all reduce maltreatment.
232
Secondary prevention involves spotting warning signs and intervening to keep a risky situation from getting worse. For example, insecure attachment, especially of the disorganized type, is a sign of a disrupted parent–
One famous program, first reported decades ago, sent nurses to visit new, low-
Early, free preschool education, especially when it includes close parent–
Tertiary prevention limits harm after maltreatment. Reporting and substantiating abuse are the first steps. Often the caregiver needs help in providing better care. Sometimes the child needs another home. Ironically, primary and secondary prevention are more effective in the long run, but projects are more likely to be funded and implemented if they begin with children who are already mistreated, and thus are tertiary prevention (Nelson & Caplan, 2014).
All levels of prevention require helping caregivers—
foster care
Putting a person (usually a child) in the care of someone other than the parents to prevent further harm.
kinship care
A form of foster care in which a relative of a maltreated child, usually a grandparent, becomes the approved caregiver.
In foster care, children are officially taken from their parents and entrusted to another adult; foster parents are reimbursed for the expenses they incur in meeting the children’s needs. In every year from 2000 to 2014, almost half a million children in the United States were in foster care. Many of them were in a special version of foster care called kinship care, in which a relative—
233
Children in both kinds of foster care do better, academically and emotionally, than children who continue to be mistreated by their biological parents. Supportive services are especially needed in kinship care, since the grandparent may also be the parent of the abusive adult and typically lives with the same poverty, racism, and violence that contributed to the original problems. All of this affects the foster child as well (Hong et al., 2011).
THINK CRITICALLY: When, if ever, should laws and communities intervene in family life?
As detailed many times in this chapter, caring for young children is not easy, whether it involves making them brush their teeth or keeping them safe from harm. Parents shoulder most of the burden, and their love and protection usually result in strong and happy children. Beyond the microsystem, however, complications abound.
WHAT HAVE YOU LEARNED?
Question 6.34
1. How do the rates of accidental and disease death compare?
Far more children die from violence—
Question 6.35
2. Why are fewer children killed by cars and trucks than previously?
This has happened in large part because of mandated child-
Question 6.36
3. When was lead proven to be toxic to children’s brains?
Chemical analysis of blood and teeth, with careful longitudinal and replicated research, proved that lead was a poison for children. The United States banned lead in paint in 1978 and automobile fuel in 1996.
Question 6.37
4. Why might poverty contribute to child maltreatment?
One argument may be that adults who were mistreated as children are more likely to mistreat their own. They also have a more difficult time finding and keeping steady work, thus causing financial strain.
Question 6.38
5. Why is reported abuse so much higher than substantiated abuse?
The 5-
Question 6.39
6. How do rates of neglect and physical abuse compare?
Neglect is the most common and most frequently fatal form of child maltreatment. In the United States, of all the substantiated cases of child maltreatment in 2013, 80 percent were neglect, while 18 percent were physical abuse.
Question 6.40
7. Why have rates of sexual abuse declined?
Over the past two decades, reports in sexual abuse have declined. One likely reason is that national awareness has led first to more reporting and then to better prevention.
Question 6.41
8. What can social programs do to achieve primary prevention of child maltreatment?
Social programs are instrumental in helping parents, neighbors, and professionals protect children. Neighborhood stability, parental education, income support, and fewer unwanted children all reduce maltreatment.
Question 6.42
9. What are the short-
The immediate harm of maltreatment is obvious, as when a child is bruised, broken, afraid to talk, or failing in school. However, the effects (drug abuse, social isolation, poor health) are still evident in adulthood. Adults who were maltreated as children have trouble finding and keeping a job as well.
Question 6.43
10. Why do developmentalists believe that tertiary prevention is too late?
Some developmentalists find it ironic that primary and secondary prevention are more effective in the long run, but projects are more likely to be funded and implemented if they begin with children who are already mistreated—
Question 6.44
11. What are the pros and cons of kinship care?
Children in kinship care do better, academically and emotionally, than children who continue to be mistreated by their biological parents. Supportive services are especially needed in kinship care, since the grandparent may also be the parent of the abusive adult and typically lives with the same poverty, racism, and violence that contributed to the original problems. Of course, all of this affects the foster child as well.