Using the Scientific Method
There are hundreds of ways to design scientific studies and analyze their results, and researchers continually try to ensure that their data and conclusions are valid. Statistical measures often help scientists discover relationships between various aspects of the data. (Some statistical perspectives are presented in Table 1.4.) Every research design, method, and statistical measure has strengths as well as weaknesses. Next we describe three basic research strategies—observation, the experiment, and the survey—and then three ways developmentalists study change over time.
| Measure | Use |
| Effect size | Indicates how much one variable affects another. Effect size ranges from 0 to 1: An effect size of 0.2 is called small, 0.5 moderate, and 0.8 large. |
| Significance | Indicates whether the results might have occurred by chance. A finding that chance would produce the results only 5 times in 100 is significant at the 0.05 level. A finding that chance would produce the results once in 100 times is significant at 0.01; once in 1,000 times is significant at 0.001. |
| Cost-benefit analysis | Calculates how much a particular independent variable costs versus how much it saves. This is particularly useful for analyzing public spending. For instance, one cost-benefit analysis showed that an intensive preschool program cost $15,166 per child (in 2000 dollars) but saved $215,000 (again, 2000 dollars) later on, in reduced costs of special education, unemployment, prison, and other public expenses (Belfield et al., 2006). |
| Odds ratio | Indicates how a particular variable compares to a standard, set at 1. For example, one study found that, although less than 1 percent of all child homicides occurred at school, the odds were similar for public and private schools. The odds of such deaths occurring in high schools, however, were 18.47 times that of elementary or middle schools (set at 1.0) (MMWR, January 18, 2008). |
| Factor analysis | Hundreds of variables could affect any given behavior. In addition, many variables (such as family income and parental education) may overlap. To take this into account, analysis reveals variables that can be clustered together to form a factor, which is a composite of many variables. For example, SES might become one factor, child personality another. |
| Meta-analysis | A “study of studies.” Researchers use statistical tools to synthesize the results of previous, separate studies. Then they analyze the accumulated results, using criteria that weight each study fairly. This approach improves data analysis by combining the results of studies that were too small, or too narrow, to lead to solid conclusions. |
| Who Participates? For all these measures, the characteristics of the people who participate in the study (formerly called the subjects, now called the participants) are important, as is the number of people who are studied. This also is presented with statistics. | |
Observation
scientific observation A method of testing a hypothesis by unobtrusively watching and recording participants’ behavior in a systematic and objective manner in a natural setting or in a laboratory; a search of archival data is another way to conduct scientific observation.
Scientific observation requires researchers to record behavior systematically and objectively. Observations often occur in a naturalistic setting such as a home, where people behave normally. Scientific observation can also occur in a laboratory, where scientists record human reactions in various situations, often with wall-mounted video cameras and the scientist in another room.
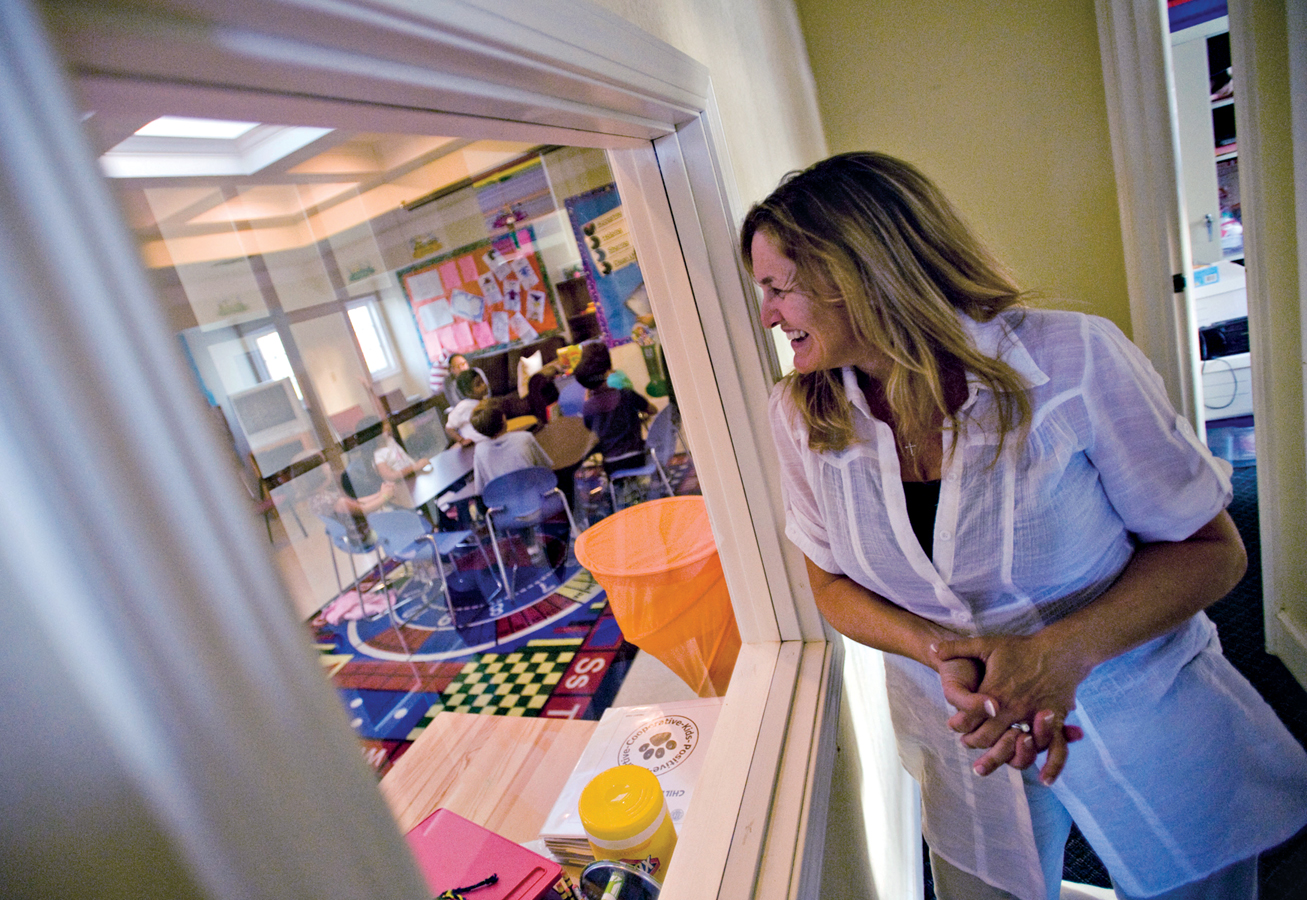
Observation is crucial to develop hypotheses. However, observation provides issues to explore, not proof. For example, one study of how long parents lingered when dropping off their children in preschool found that children were slower to engage with toys or friends when their parents stayed longer (Grady et al., 2013). This could mean that parental hesitancy to leave made children less social with friends. However, the opposite interpretation is also possible. Perhaps those children who were shyer and less social caused their parents to stay longer. Thus this study led to two alternative hypotheses: More research is needed to ascertain which one is more accurate.
23
Especially for Nurses In the field of medicine, why are experiments conducted to test new drugs and treatments?
Response for Nurses: Experiments are the only way to determine cause-and-effect relationships. If we want to be sure that a new drug or treatment is safe and effective, an experiment must be conducted to establish that the drug or treatment improves health.
24
The Experiment
experiment A research method in which the researcher tries to determine the cause-and-effect relationship between two variables by manipulating one (called the independent variable) and then observing and recording the ensuing changes in the other (called the dependent variable).
The experiment establishes what causes what. In the social sciences, experimenters typically impose a particular treatment on a group of volunteer participants or expose them to a specific condition and then note whether their behavior changes.
independent variable In an experiment, the variable that is introduced to see what effect it has on the dependent variable. (Also called experimental variable.)
dependent variable In an experiment, the variable that may change as a result of whatever new condition or situation the experimenter adds. In other words, the dependent variable depends on the independent variable.
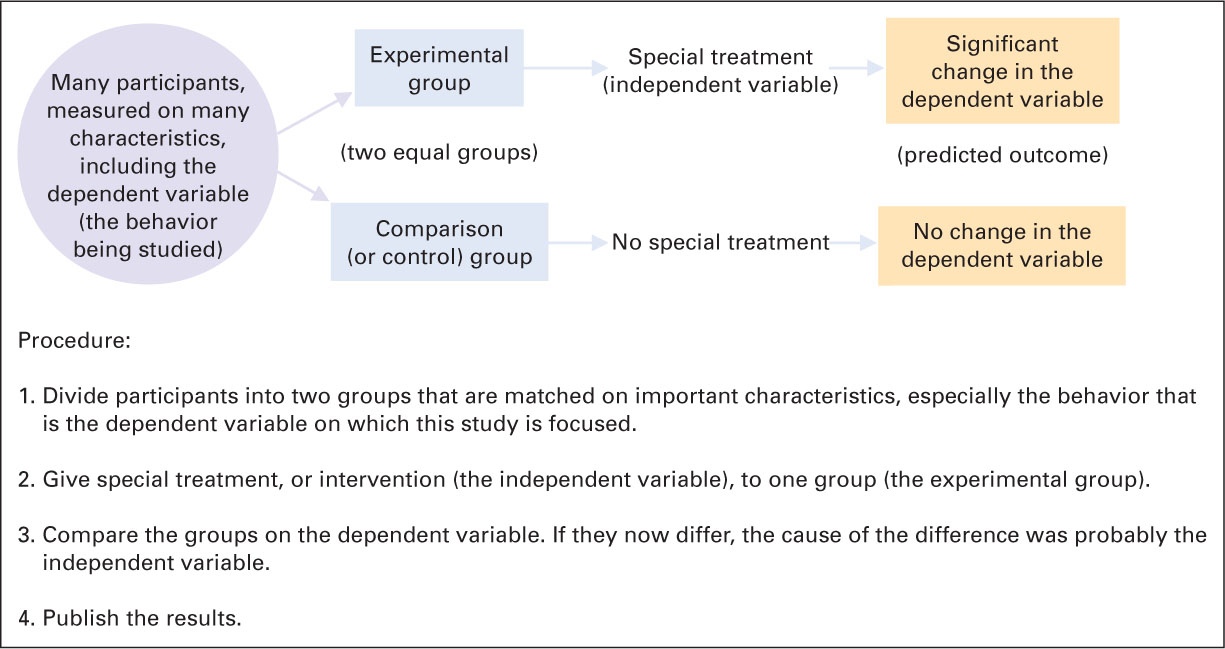
In technical terms, the experimenters manipulate an independent variable, which is the imposed treatment or special condition (also called the experimental variable; a variable is anything that can vary). They note whether this independent variable affects whatever they are studying, called the dependent variable (which depends on the independent variable).
Thus, the independent variable is the new, special treatment; any change in the dependent variable is the result. The purpose of an experiment is to find out whether an independent variable affects the dependent variable. In a typical experiment (as diagrammed in Figure 1.8), two groups of participants are studied. One group, the experimental group, is subjected to the particular treatment or condition (the independent variable); the other group, the comparison group (also called the control group), is not.
The Survey
survey A research method in which information is collected from a large number of people by interviews, written questionnaires, or some other means.
A third research method is the survey, in which information is collected from a large number of people by interview, questionnaire, or some other means. This is a quick, direct way to obtain data.
25
Unfortunately, although surveys may be quick and direct, they are not necessarily accurate. When pollsters try to predict elections, they survey thousands of potential voters. They hope that the people they survey will vote as they say they will, that undecided people will follow the trends, and that people who refuse to give their opinion, or who are not included, will be similar to those surveyed. None of this is certain. Some people lie, some change their minds, some (especially those who don’t have phones or who never talk to strangers) are never counted.
Furthermore, survey answers are influenced by the wording and the sequence of the questions. For instance, “climate change” and “global warming” are two ways to describe the same phenomenon according to many scientists, yet many people believe in climate change but not in global warming (McCright & Dunlap, 2011). For that reason, surveys that seem to be about the same issue may reach opposite conclusions.
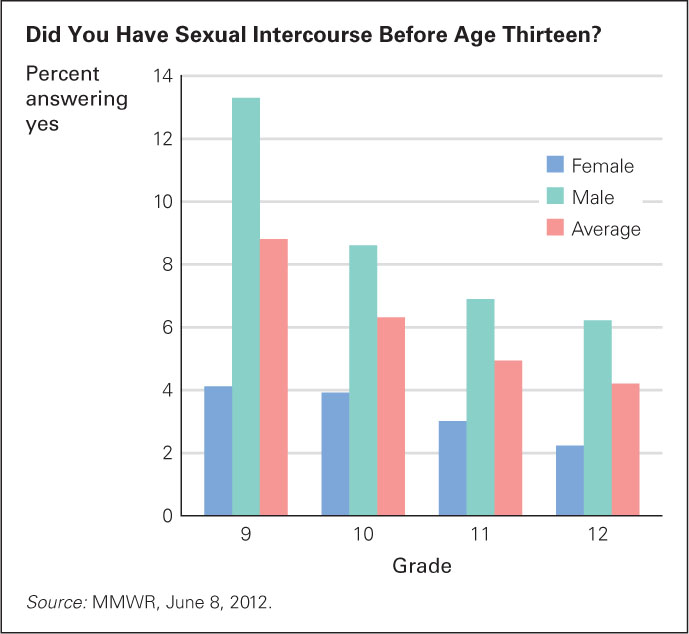
Additionally, survey respondents present themselves as they would like to be perceived. For instance, every two years since 1991, high school students in the United States have been surveyed. The participants are carefully chosen to be representative of all students in the nation. The most recent survey included 15,503 students from all 50 states and from schools large and small, public and private (MMWR, June 8, 2012).
Students are asked whether they had sexual intercourse before age 13. Every year, compared to the twelfth-grade boys, about twice as many ninth-grade boys say they had sex before age 13 (see Figure 1.9). Do seniors forget or do ninth-graders lie? Or are some 13-year-olds proud of early sexual experience but ashamed by age 17?
case study An in-depth study of one person, usually requiring personal interviews to collect background information and various follow-up discussions, tests, questionnaires, and so on.
To understand responses in more depth, another method can be used—the case study, which is an in-depth study of one person. Case studies usually require personal interviews, background information, test or questionnaire results, and more. Although in some ways case studies seem more accurate than more superficial measures, in other ways they are not: The assumptions and interpretations of the researcher are more likely to bias the results than they would a survey that includes hundreds of participants.
Even if accurate, the case study applies only to one person, who may be quite unlike other people. For instance, my report on my nephew David is a case study, but David is unique: Other embryos exposed to rubella may have quite different lives than David’s.
Studying Development over the Life Span
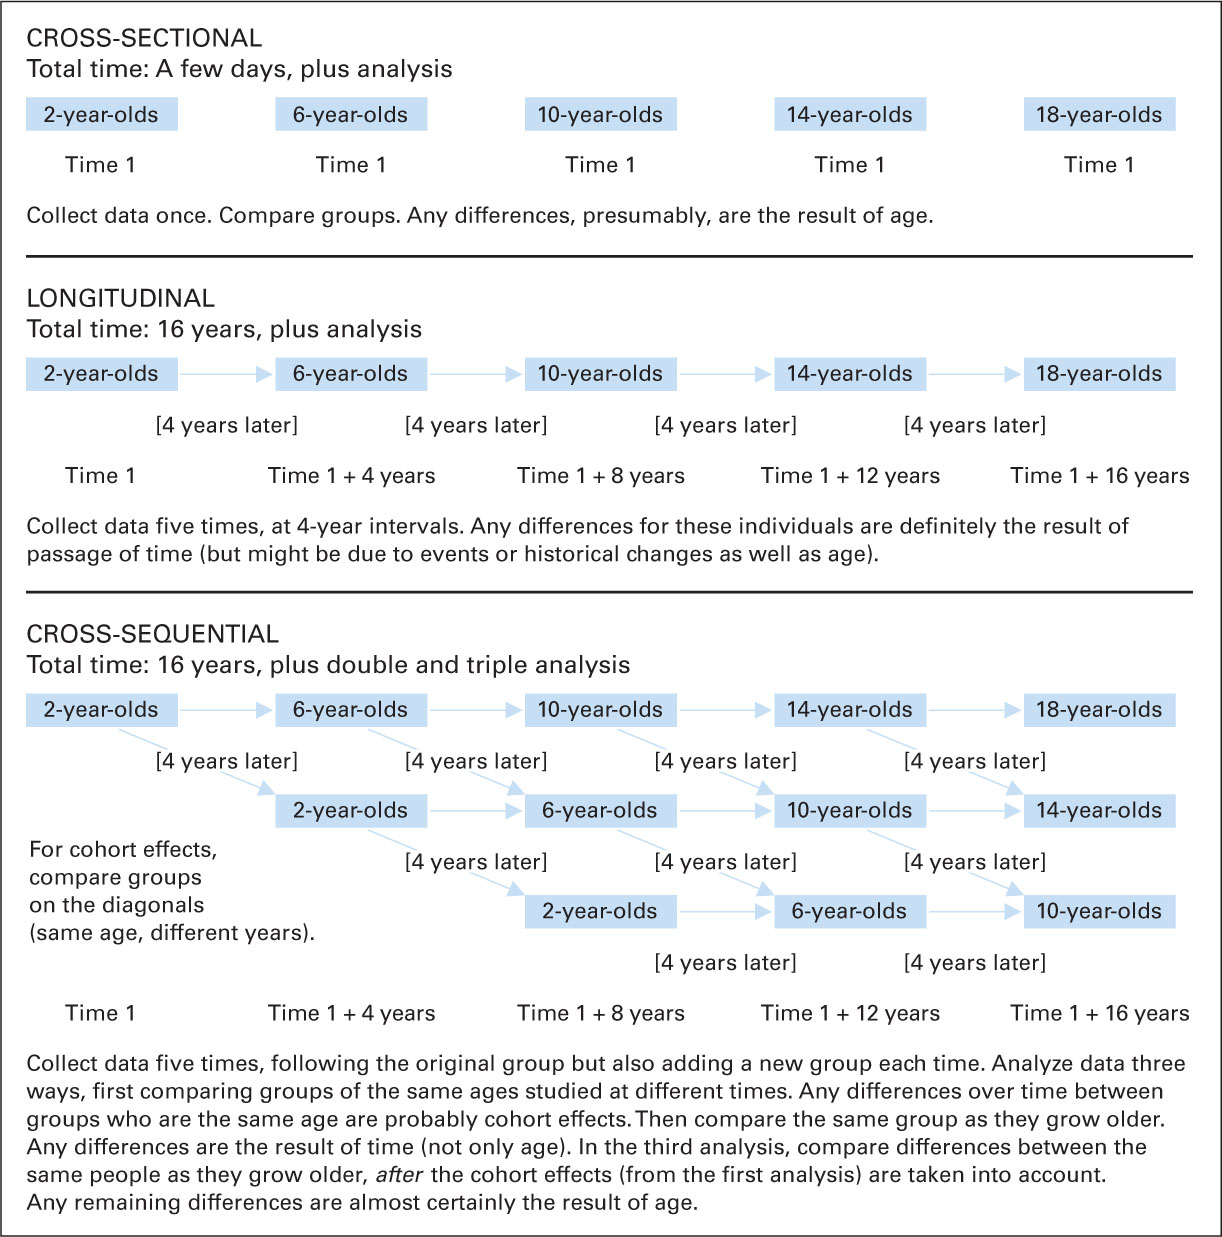
In addition to conducting observations, experiments, and surveys, developmentalists must measure how people change or remain the same over time. They use one of three basic research designs: cross-sectional, longitudinal, or cross-sequential (see Figure 1.10).
Cross-Sectional Research
cross-sectional research A research design that compares groups of people who differ in age but are similar in other important characteristics.
The quickest and least expensive way to study development over time is with cross-sectional research, in which groups of people of one age are compared with groups of people of another age. Such research has found, for instance, that in the United States in 2012, 74 percent of men aged 25 to 29 were in the labor force, but only 52 percent of those aged 60 to 64 were (U.S. Bureau of Labor Statistics, 2011). It seems that about one-third of all men stop working between age 30 and age 60. Younger adults might imagine them golfing in the sun, happy with their pensions and free time.
26
Cross-sectional design seems simple. However, it is difficult to ensure that the various groups being compared are similar in every way except age. In this example, the younger U.S. men, on average, had more education than the older ones. Thus, what seems to be the result of age might actually have to do with schooling: Perhaps education, not age, accounted for the higher employment rates of the younger adults. Or perhaps age discrimination was the problem: The older adults may have wanted jobs but been unable to get them.
27

Longitudinal Research
longitudinal research A research design in which the same individuals are followed over time and their development is repeatedly assessed.
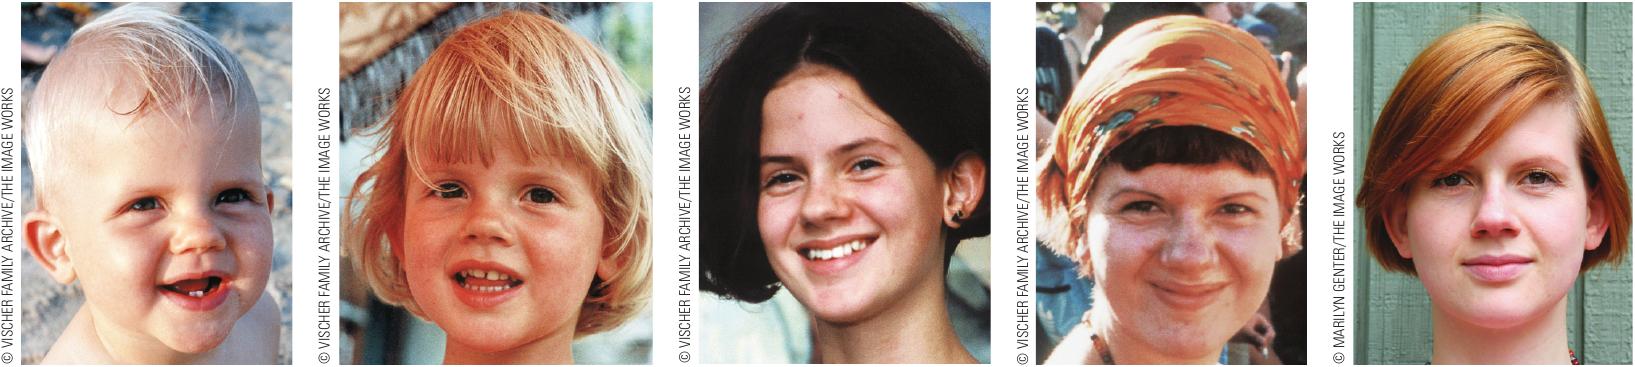
To help discover whether age itself rather than cohort causes a developmental change, scientists undertake longitudinal research. This research requires collecting data repeatedly on the same individuals as they age. Longitudinal research is particularly useful in tracing development over many years.
Longitudinal research has several drawbacks, however. Over time, participants may withdraw, move to an unknown address, or die. Another problem is that participants become increasingly aware of the goals of the study—knowledge that makes them less typical, and thus the results become less valid.
Finally, the historical context changes, which limits the current relevance of data on people born decades ago. Results from longitudinal studies of people born in 1910 may not be applicable to people born in 2010.
Longitudinal research requires years of data. For example, alarm about possible future harm caused by ingesting phthalates and bisphenol A (BPA) (chemicals used in manufacturing) from plastic baby bottles and infant toys leads many parents to use glass baby bottles. But perhaps the risk of occasional shattered glass causes more harm than the chemicals in plastic, or perhaps the mother’s use of cosmetics, which puts phthalates in breast milk, is a much greater source of the chemicals than any bottles (Wittassek et al., 2011). Could breast-feeding harm infants? Pediatricians believe that the benefits of breast milk outweigh any dangers, but we need answers now, not decades from now.
28
Cross-Sequential Research
cross-sequential research A hybrid research design in which researchers first study several groups of people of different ages (a cross-sectional approach) and then follow those groups over the years (a longitudinal approach). (Also called cohort-sequential research or time-sequential research.)
Scientists have found a third strategy, combining cross-sectional and longitudinal research, called cross-sequential research (also referred to as cohort-sequential or time-sequential research). With this design, researchers study several groups of people of different ages (a cross-sectional approach) and follow them over the years (a longitudinal approach).
With cross-sequential design, researchers compare findings for a group of, say, 18-year-olds, with findings for the same individuals at age 6-year-olds, as well as with findings for groups who were 18 a decade or two earlier and with findings for groups who are currently 6-year-olds (see Figure 1.10). Cross-sequential research is complicated, in recruitment and analysis, but it lets scientists disentangle the effects of age from the effects of history.
One well-known cross-sequential study (the Seattle Longitudinal Study) found that some intellectual abilities (vocabulary) increase even after age 60, whereas others (processing speed) start to decline at age 30 (Schaie, 2005).
Especially for Future Researchers What is the best method for collecting data?
Response for Future Researchers: There is no best method for collecting data. The method used depends on many factors, such as the age of participants (infants can’t complete questionnaires), the question being researched, and the time frame.
Some recent cross-sequential research discovered that some factors affect the mental health of children more during middle childhood than infancy. Absent or unemployed fathers are among such factors (Sanson et al., 2011), a discovery that could not have been made by cross-sectional or longitudinal research in isolation.
SUMMING UP
Scientists use many methods and research designs to investigate development. Ideally, conclusions from one type of study are confirmed by other types. Careful and systematic observation can discover phenomena that were previously unnoticed, and then experiments can investigate hypotheses to uncover causes. Surveys are quick but vulnerable to bias in the questions asked and answers given. Case studies are detailed, but it is folly to draw general conclusions from the specifics of any one individual.
To study change over time, cross-sectional, longitudinal, and cross-sequential designs are used, each with advantages and disadvantages. Cross-sectional is quickest, longitudinal may be more accurate, and cross-sequential combines the two, reaching conclusions that neither cross-sectional nor longitudinal research could find in isolation.