1f. Drafting the body
The body of your essay develops support for your thesis, so it’s important to have at least a working thesis before you start writing. What does your thesis promise readers? What question are you trying to answer? What problem are you trying to solve? What is your position on the topic? Keep these questions in mind as you draft the body of your essay.
You may already have written an introduction that includes your working thesis. If not, as long as you have a draft thesis you can begin developing the body and return later to the introduction. If your thesis suggests a plan (see 1e) or if you have sketched a preliminary outline, try to organize your paragraphs accordingly.
Draft the body of your essay by writing at least one paragraph about each supporting point you listed in the planning stage. If you do not have a plan, pause for a few moments and sketch one (see 1d). As you draft the body, keep asking questions; keep anticipating what your readers may need to know.
Keep in mind that often you might not know what you want to say until you have written a draft. It is possible to begin without a plan—assuming you are prepared to treat your first attempt as a “discovery draft” that may be radically rewritten once you discover what you really want to say. Whether or not you have a plan when you begin drafting, you can often figure out a workable order for your ideas by stopping each time you start a new paragraph to think about what your readers will need to know to follow your train of thought.
For more detailed help with drafting and developing paragraphs, see 3.
using sources responsibly: As you draft, keep careful notes and records of any sources you read and consult. If you quote, paraphrase, or summarize a source, include a citation, even in your draft (see 54b, 59b, and 63b). You will save time and avoid plagiarism if you follow the rules of citation while drafting.
Adding visuals as you draft
As you draft, you may decide that some of the support for your thesis could come from one or more visuals. Visuals can convey information concisely and powerfully. Charts, graphs, and tables, for example, can simplify complex numerical information. Images—including photographs and diagrams—often express an idea more vividly than words can. Keep in mind that if you download a visual—or use published information to create your own visual—you must credit your source. The chart at the bottom of the page describes eight types of visuals and their purposes.
Always consider how a visual supports your purpose and how your audience might respond to it. A student writing about electronic surveillance in the workplace, for example, used a cartoon to illustrate her point about employees’ personal use of the Internet at work (see 57b). Another student, writing about treatments for childhood obesity, created a table to display data she had found in two different sources and discussed in her paper (see 62b). Note that these students use visuals to supplement their writing, not to substitute for it.
Considering design as you draft
Aside from planning visual evidence for your ideas, you will need to think about how to format your paper. Formatting, or designing, your document promotes readability and helps you meet the expectations of your readers and the requirements of the genre. The following questions will help you to keep your purpose and audience in mind as you design your document.
- What is the purpose of your document? How can your document design help you achieve this purpose?
- Who are your readers? What are their expectations?
- What format is required? What format options—layout, margins, line spacing, and font styles—will readers expect?
- How should you place and label any visuals you decide to use?
See the appendix for sample pages from a variety of academic and business documents. Each is annotated to illustrate specific design guidelines.
using sources responsibly: If you create a chart, table, or graph using information from your research, you must cite the source of the information even though the visual is your own. If you download a photograph from the Web or scan an image from a magazine or book, you must credit the person or organization that created it, just as you would cite any other source that you use in a college paper (see 54a, 59a, or 63b, depending on what documentation style your assignment requires).
Choosing visuals to suit your purpose
Pie chart
| Pie charts compare a part or parts to the whole. Segments of the pie represent percentages of the whole (and always total 100 percent). |
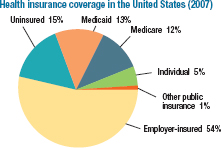
source: Kaiser Foundation |
Bar graph (or line graph)
| Bar graphs highlight trends over a period of time or compare numerical data. Line graphs display the same data as bar graphs; the data are graphed as points, and the points are connected with lines. |
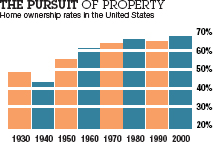
source: US Census Bureau |
Infographic
| An infographic presents data in a visually engaging form. The data are usually numerical, as in bar graphs or line graphs, but they are represented by a graphic element instead of by bars or lines. |
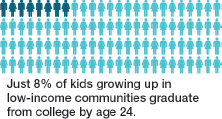
source: postsecondary.org |
Table
| Tables display numbers and words in columns and rows. They can be used to organize complicated numerical information into an easily understood format. |
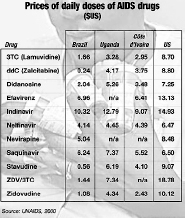
source: UNAIDS |
Photograph
| Photographs vividly depict people, scenes, or objects discussed in a text. |

source: Fred Zwicky |
Diagram
| Diagrams, useful in scientific and technical writing, concisely illustrate processes, structures, or interactions. |

source: NIAMS |
Flowchart
| Flowcharts show structures (the hierarchy of employees at a company, for example) or steps in a process and their relation to one another. (See also section 19 for another example.) |
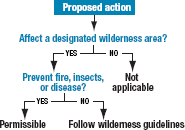
source: Arizona Board of Regents |
Map
| Maps illustrate distances, historical information, or demographics and often use symbols for geographic features and points of interest. |
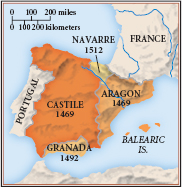
source: Lynn Hunt et al. |