2.3 Data: Quantitative and Qualitative
Research designs are plans for collecting scientific evidence. Now let’s look at the evidence that is collected.
When psychologists gather scientific evidence, they call it “data.” Data are any type of information obtained in a scientific study. There are two kinds: quantitative and qualitative.
Quantitative data are numerical. In quantitative research methods, participants’ responses are described in terms of numbers. A psychologist who computes people’s scores on an intelligence test, or records heart rate when workers with a tight job deadline are stressed, or times the number of seconds it takes people to perform a task, or counts the number of men who call a female experimenter (from our opening story) is collecting quantitative data. Most studies in psychology employ quantitative methods.
Qualitative data are sources of scientific information that are not converted into numbers. Qualitative research methods, then, are any of a wide range of methods in which researchers observe, record, and summarize behavior using words rather than numbers.
Let’s begin our coverage of data in psychology with quantitative data.
52
Quantitative Data
Preview Questions
Question
 What is measurement? What are three examples of measurement in psychology?
Question
What is an operational definition?
Question
In the measurement of variables, what are reliability and validity?
Question
What are some potential advantages and disadvantages of quantitative methods?
Question
What does it mean to say that a study’s outcomes are statistically significant?
One of the biggest surprises of introductory psychology is all the numbers involved. Before taking the course, you might expect that words would suffice. When you contemplate the thoughts in your mind, you mostly encounter words, not numbers. When you experience complex, “mixed” emotions—
MEASUREMENT. Psychologists get their numbers through a process called measurement, which is any technique that assigns numbers to information about objects or events (Stevens, 1948). (Later we’ll present the specialized scientific equipment used to get this information, in the section “Obtaining Scientific Evidence.” Here, we focus on the process of measurement itself.)
When it comes to physical properties, measurement is familiar. You measure length with a ruler and temperature with a thermometer. In doing so, you assign numbers (in centimeters and degrees, respectively) to physical properties (the distance from one end of a pencil to the other; the warmth of a room).
But what about psychological properties? People’s thoughts, feelings, abilities, attitudes, and personality characteristics don’t have length, width, or mass. So how can we measure them? The key step is to operationally define the psychological characteristics.
An operational definition specifies a procedure through which a property can be measured. The result of the procedure is, by definition, a measurement of the property. Here are examples of operational definitions for three psychological properties: (1) intelligence, (2) self-
Intelligence: You could ask people difficult questions and count how many they answered correctly. The result of the measurement procedure, the number of correct answers, would be, by definition, a measure of intelligence.
Self-
esteem: Present people with a series of statements that refer to oneself (e.g., “I feel that I have a number of good qualities”) and ask them to indicate agreement or disagreement with each statement. Their average level of agreement or disagreement is an index of self- esteem (Rosenberg, 1965). What, beyond intelligence, do your final grades measure?
Fearful reactions among infants: Because the participants in this case are infants, your procedures cannot include words (e.g., instructions or test questions). However, you are able to measure infants’ behavior. For example, you could (1) stage surprising, potentially startling events in the infants’ vicinity (e.g., a puppet head suddenly pops up behind a screen); (2) record their reactions on video; and (3) code the footage, measuring the degree to which each infant cries or displays other physical signs of agitation (Kagan & Snidman, 1991).
53

Sometimes researchers employ different operational definitions of the same property. One may operationally define fear, for example, in terms of behavioral reactions, whereas another might operationally define it with a questionnaire that asks people to describe their tendency to become fearful. These differences can cause substantial problems when one tries to interpret research findings (Kagan, 1988). The different procedures might produce conflicting results. Consider what would happen in the case of studying fear if some people who, behaviorally, experience a lot of fear describe themselves on the questionnaire as calm and fearless (Myers, 2010). (They might say this to impress others or to convince themselves that they are not so afraid.) Research using a behavioral definition would indicate that those people are “high in fear,” whereas research using a questionnaire-

54
RELIABILITY AND VALIDITY. Once you decide on a measurement procedure, how do you know it is a good one? Measures should have two properties: reliability and validity.
Reliability: A measure possesses reliability if it measures a psychological property consistently. Consider the cases above. When people take intelligence tests on two different occasions, their scores usually are consistent, even when testing sessions are years apart (Watkins & Smith, 2013). Similarly, people’s self-
esteem scores generally are consistent across years of life (Trzesniewski, Donnellan, & Robins, 2003). Both measures thus possess reliability. If, hypothetically, many people obtained a low score on one testing occasion and a high score on another, the test would lack reliability. Validity: A measure possesses validity if it measures what it is supposed to measure. Timing people in the 100-
meter dash would be an invalid indicator of intelligence because a measure of running speed does not measure what you are supposed to be measuring, intelligence. Recent advances in the study of measurement provide a more precise definition of the concept. A measure is valid if “variations in the attribute [being measured] causally produce variations in the outcomes of the measurement procedure” (Borsboom, Mellenbergh, & van Heerden, 2004, p. 1061). For instance, when people step on a bathroom scale, variations in their weight (the attribute being measured) produce variations in the numbers the scale displays (the outcome of the measurement procedure). Thus, we know that the bathroom scale validly measures what it is supposed to measure, weight.
It is possible for a measure to be reliable without being valid. Revisiting the 100-
THE ADVANTAGES OF NUMBERS. Measurement, then, is the answer to “Where are all these numbers coming from?” There’s another question, however: Why do we want numbers, or what are the advantages of quantitative data?
There are three advantages, involving comparison, conciseness, and precision.
Comparison: Psychologists often want to compare the actions or experiences of different people. Numbers make comparisons easy. Let’s say you want to compare the degree to which two people are experiencing psychological depression. Without quantitative data, the comparison would be difficult. If one person says, “I’ve been feeling really down lately—
sad and with little energy,” and another remarks, “I don’t seem to be interested in doing much these days; I can hardly get myself out of bed,” it is impossible to tell which of the two is more severely depressed. But a quantitative measure of depression (e.g., Beck, Steer, & Brown, 1996)—that is, one that produces a value indicating the level of depression people are experiencing— yields numbers that can be compared easily. Conciseness: Psychologists need to communicate information concisely. They often must report the results of studies with large numbers of people in the limited space available for research reports in scientific journals. Numbers can be summarized concisely through statistical methods (discussed below and in the Statistics Appendix) and graphs (Figure 2.7). By comparison, words—
for example, transcriptions of interviews— are difficult to summarize concisely (although methods to create such summaries have been developed; Grbich, 2009). Precision: Science needs precision. Throughout the history of science, precise measurements have fueled theoretical advances. Words—
such as “The moon is really far away” or “Objects accelerate quite quickly when you drop them”—are imprecise. Numbers— such as “The moon is 239,000 miles away” or “Objects accelerate at 9.8 meters per second squared when you drop them”—possess the precision that science needs. 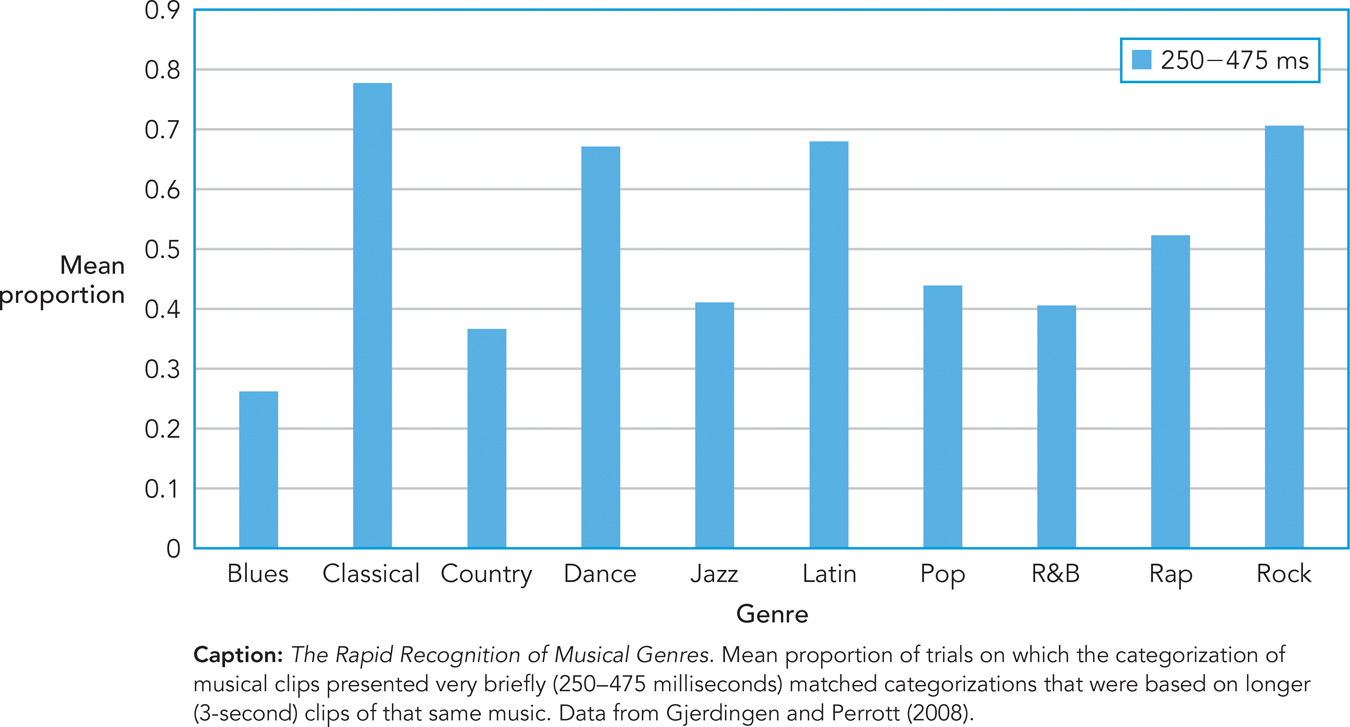 figure 2.7 How to read a graph Quantitative data can be presented concisely in graphs. Here’s a tip for reading them: Read graphs from the outside in. Read the caption and the labels (the outside) first, and only then look at the bars, lines, and other data reports (the inside). If you do this carefully, you often can learn a lot about a study from the graph alone.
Let’s try this with the graph above. From the outside (the caption and the labels) you learn that:- Researchers played clips of pieces of music for (a) a small fraction of a second (250–
475 milliseconds) and (b) 3 seconds. The clips represented various musical genres (blues, classical, etc.).
After hearing each clip, participants categorized its genre.
Researchers determined whether participants’ categorizations of the short and long clips of a given piece of music matched.
Now look inside the graph, at the columns. You see a remarkable result. Even though the short clips were extremely short—
blips of sound as brief as a quarter of a second— participants could recognize them. For classical and rock music, a mere quarter- second of sound was sufficient for participants to categorize the music in a manner that matched the categorization of the long clips. People can recognize music quickly! And people can learn a lot from a graph. - Researchers played clips of pieces of music for (a) a small fraction of a second (250–
55
THIS JUST IN
Big Data
Suppose you want to answer the following question: Do media reports (e.g., major stories reported in the news) affect people’s everyday behavior? If, for example, the media reports on an environmental disaster, do people subsequently spend more time learning about the environment?
A researcher’s first challenge is to figure out how one could possibly answer that question. Some traditional methods are limited. For example, responses to a survey that asks people, “Does the media affect your behavior?” might not be accurate. The media might have more (or less) effect on behavior than people realize.
Making matters more difficult, the question concerns people in general: the tens or hundreds of millions of people who might hear the media report. How could you learn how all of them responded after hearing a piece of news?
You could do it with big data. “Big data” refers to the wealth of information that exists in digital records, that is, computer-
56
Researchers use novel methods to analyze big data. One is data-
A team of researchers interested in science education wanted to know whether media coverage of science news leads people to seek out more information about scientific topics (Segev & Baram-
News coverage of science—
the amount of coverage of scientific topics in Internet news sources at any given time period, and Search queries on scientific topics—
the number of Google Internet searches for science- related information at any given time.
By accessing records across a five-
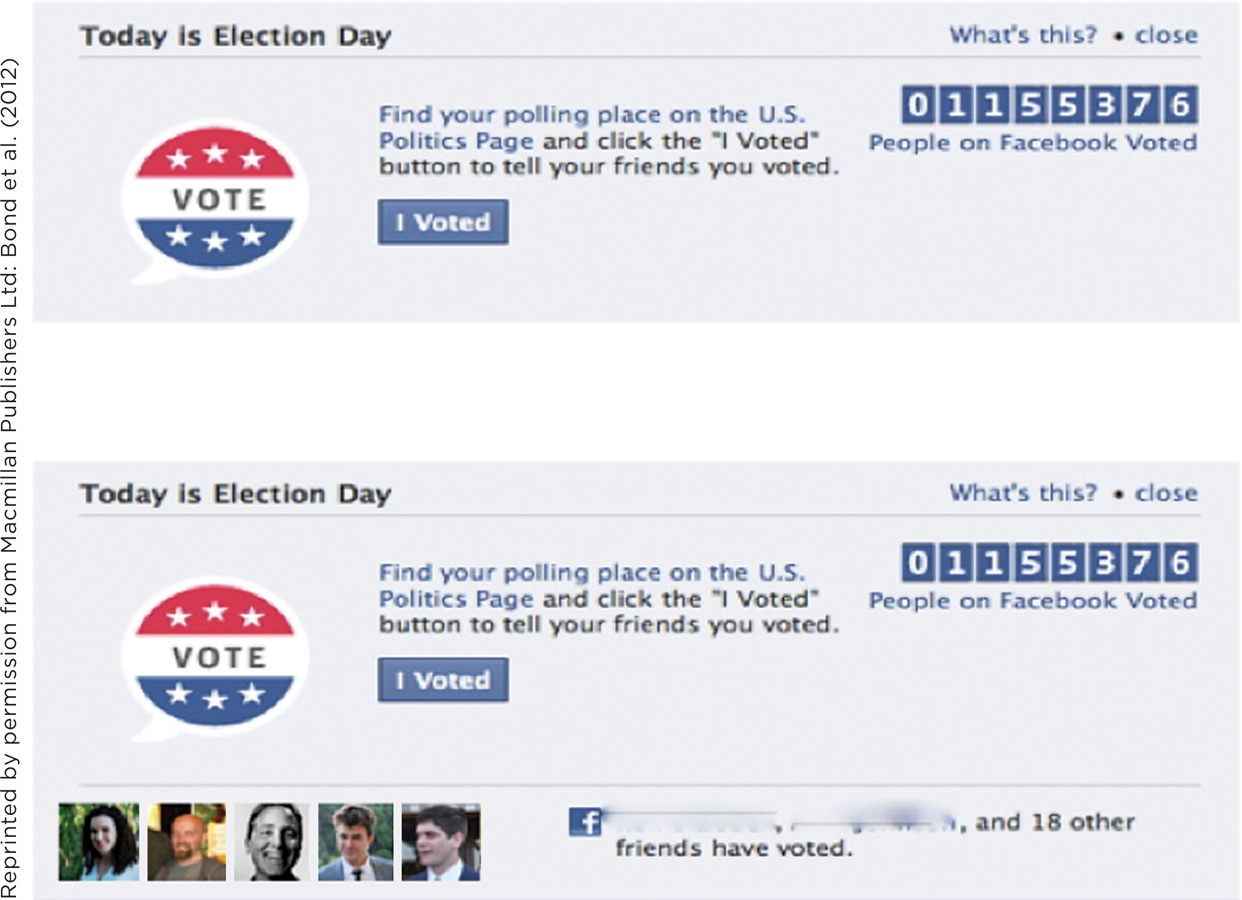
This particular big data research result is correlational; the volume of Internet searches correlated with news coverage and time of year. As you know, though, correlation does not prove causation; to establish causation, an experiment is needed. Fortunately, big Internet-
The social message proved to be influential. An analysis of public voting records showed that people who received the social message were significantly more likely to vote than were those who received only the informational message (Bond et al., 2012).
With its unique ability to provide information about the actual behavior of millions of people, big data will likely have a big future in psychological science.
57
WHAT DO YOU KNOW?…
Question 11
Everything we do on the Internet leaves a digital record and this entire data set, referred to as “big biruUsbv6+znSy9n,” can be analyzed using data I5ADhJKLt5WxcDC4 techniques. In one such study, researchers demonstrated there is a correlation between Internet news coverage and the volume of search queries. Correlation does not prove JeN6q13QLK7Z4gQPSLgjOA==, but other experimental research confirms that a link exists between the information we run across on the Internet and our everyday behavior.
MEASUREMENT PRINCIPLES IN PRACTICE. Now let’s see how measurement works in practice. We’ll look at two examples, the first of which involves political attitudes.
Suppose you want to study attitudes about a political question: Should the government allow companies to drill for oil in wilderness areas? If you ask people to express their attitudes in words, you will get information that is neither concise nor precise (“Well, I don’t know, I guess I’m sort of against it, but the nation does need a lot of energy”). So you need numbers. To get them, take the two steps described earlier:
Operationally define the variable: You could ask people, “Are you in favor of, or opposed to, the government allowing companies to drill for oil in wilderness areas?” Then ask them to respond on a scale ranging from “in favor of” to “opposed to.” The scale could look like this:

Assign numbers to observed variations: In this case, assigning numbers is easy; simply number the scale.

Researchers would ask precisely the same question to all participants, each of whom would respond using the same easy-
Our second example is a little more complex. Psychologists who study performance in mathematics may ask whether any two math problems—
58
Operationally define the variable: Operationally defining this variable is tricky. There’s no reliable way to ask people, “How much thinking did you do?” because they can’t keep track of all the thoughts running though their heads—
especially while they’re concentrating on math problems. But here’s something you can do: Time how long it takes people to solve the problem (Menon, 2012; Posner, 1978). Like any activity, thinking takes time. More thinking takes more time. Because additional steps of thinking require additional time, greater amount of thinking can be defined operationally as greater amount of time taken to solve the problem. - Assign numbers to observed variations: Again, in this case, assigning numbers is easy—
simply count time in seconds. To determine whether more thinking was required to solve Problem A or Problem B, count the number of seconds it takes each participant to solve each problem and calculate whether, on average, it took longer to solve Problem A or Problem B.
SUMMARIZING AND ANALYZING NUMBERS: STATISTICS. Suppose you were measuring a variable discussed earlier, attitudes about oil drilling in wilderness areas. After you’ve collected 100 people’s responses, someone asks, “What were people’s attitudes like?” There are two ways to answer. You could list all 100 responses, one by one: “The first person indicated a 5 on my 7-
Statistics are mathematical procedures for summarizing sets of numbers. Some of the procedures, called descriptive statistics, describe what, in general, the numbers are like. Others, called inferential statistics, help scientists draw conclusions about the numbers (to conclude whether one group of numbers differs from a second group). This book’s Statistics Appendix presents descriptive and inferential statistics in detail. Here, we provide a brief overview.
When describing a set of numbers, one commonly wants to know what the numbers are like, on average. You can probably tell intuitively that answering the question “What were people’s attitudes like?” requires knowing the average attitude score. You can determine the average by computing the statistical mean, the value obtained by adding up all the scores and dividing by the number of scores that there were. (For our attitude example, you would add up the scores and divide by 100.)
A second descriptive statistic is the standard deviation, which describes the degree to which numbers vary (or “deviate”) from the mean. Consider two sets of numbers:
Set A: 1 1 2 2 4 6 6 7 7
Set B: 3 3 3 3 4 5 5 5 5
They have the same mean (4). But in Set A, the numbers vary from the mean to a greater degree than in Set B. The numbers in Set A therefore have a larger standard deviation.
After summarizing results with statistics such as the mean and standard deviation, psychologists often want to know whether the results differ from chance. The concept of differing from chance can be illustrated with a simple example. A flipped coin is expected to come up heads half the time and tails half the time. If you flip it 100 times, and it comes up heads 52 times instead of 50, you don’t think, “Unbelievable! Two more heads than the expected 50!” You know this small difference, 52 instead of 50, can occur just by chance. But now imagine that instead of 52 heads, you got 92. That would be bizarre! It would differ so much from what was expected—
Statistical procedures can determine whether observed outcomes differ from the outcome expected by chance. Observed outcomes that differ from what would be expected by chance are called statistically significant. In our example above, 92 heads out of 100 would be a statistically significant outcome, whereas 52 out of 100 would not. The inferential statistics used to determine whether results vary from chance are called significance tests. (Principles of statistical significance are detailed in our Statistics Appendix.)
A common application of significance tests is determining whether two or more groups of numbers—
59
Researchers usually analyze data from one study at a time. However, they sometimes summarize results from multiple studies. Meta-

LIMITATIONS OF QUANTITATIVE DATA. Quantitative data are the bread-
One shortcoming is that quantitative measures may fail to reveal information that could be detected in qualitative research (discussed below). In many quantitative studies, researchers construct a survey or questionnaire that is administered, in the same form, to all research participants. But participants might have important thoughts, feelings, and personal experiences not included in the survey. Suppose you wanted to survey college freshmen’s thoughts about factors that had “the biggest impact” on their past education. You might ask them to rate, on 7-

Do you prefer quantitative multiple-
Another limitation is that numbers may fail to represent the complexity of some psychological characteristics. Consider people’s personalities. Many personality tests assign to individuals scores on personality traits such as being warm-
60
“I have a very welcoming personality that greets people with a smile or a nice joke or even a nice little hug, [but] another aspect of my personality is my mean side.”
“I’m nice, helpful, kind, sweet … I’m easy to get along with [but] I have a quick and bad temper. I get jealous easily … very moody … bossy.”
“[I am] organized for the most part [but] very rushed and messy at home.”
“I like to be on time or early for a scheduled event [but] on things that I am less interested in doing I put off until close to deadline time.”
No single “procrastination score” could, for example, describe the fourth person’s tendency to procrastinate, which varies from one situation to another. A single quantitative “procrastination score,” then, would not do a good job of describing that person. With such concerns in mind, some researchers opt for qualitative data.
WHAT DO YOU KNOW?…
Question 12
For each of the “answers” below, provide the question. The first one is done for you.
A. Answer: Using scores on a final exam to indicate understanding of course content would be an example of this kind of definition.
Question: What is an operational definition?
Qualitative Data
Preview Questions
Question
What are qualitative research methods? What are three examples of research that obtains qualitative data?
Question
What are three advantages of qualitative data? What are some reasons most psychologists prefer quantitative to qualitative data?
Qualitative data, as we noted above, are sources of scientific information that are not converted into numbers. Words are the main type of qualitative data. Psychologists conducting qualitative research may ask participants to describe, in their own words, their experiences and life circumstances. They then summarize and interpret participants’ statements in words, rather than numbers.
The biggest source of qualitative information in psychology is interviews (Potter & Hepburn, 2005). Other information sources, such as observation of behavior in naturally occurring situations, also can provide qualitative research evidence. But interviews are most common. Let’s look at an example involving efforts to halt the spread of HIV/AIDS in sub-
HIV/AIDS efforts hold promise and have achieved much success already, yet they present a puzzle. Drugs can now stop the disease from progressing, and in sub-
A team of researchers knew the reasons could be complex; simple quantitative survey items might not uncover them. So they conducted a qualitative study. They interviewed patients in Nigeria, Tanzania, and Uganda who had missed treatment for three months or more (Ware et al., 2013). The patients discussed circumstances associated with their missed appointments, as well as their experiences at the medical clinics. Analysis of the study’s qualitative data indicated that patient dropout often resulted from “complex chains of events” (Ware et al., 2013, p. 6) involving both the challenges of life in sub-
61
When you go to look for money for [a motorcycle taxi] you find you do not have it. So … you miss your appointment and go to clinic on another day, [and the provider] starts quarreling with you about not having come on the appointed day. And when you tell that person you got problems, he tells you, “You should spend the night on the road.” How can I spend the night on the road? Here I am, having failed to get money for taking me to the hospital and then I’m supposed to get money to spend the night somewhere and feed myself? These are some of the problems I have in going to the clinic.
—Ware et al. (2013, p. 6) *
* © 2013 Ware et al. (2013). Toward an understanding of disengagement from HIV treatment and care in sub-
Such complex, culturally situated reasons might never have been uncovered in a traditional quantitative study.
ADVANTAGES OF QUALITATIVE DATA. Three considerations motivate psychologists to obtain qualitative, rather than quantitative, data: the desire to (1) understand personal meaning, (2) reflect the storylike quality of lives, and (3) obtain evidence that is naturalistic. Let’s consider them.
The personal meaning of an event is its significance for the individual who is experiencing it. Personal meaning is hard to capture in numbers (Polkinghorne, 2005). Suppose a friend says, “I’m fed up with you.” You’re puzzled and want more information. But the information you want is not a number (“Exactly how fed up are you, on a scale from 1 to 7?”) Instead, you want to know exactly what the statement means—
People’s understanding of their own lives often has a storylike structure—

Naturalistic evidence is true-
THREE TYPES OF QUALITATIVE STUDIES. Let’s look at three types of qualitative studies: (1) clinical case studies, (2) qualitative observational studies, and (3) qualitative community-
62
A case study is a detailed analysis of one particular person or group of people; the person or group is the “case.” In psychology, a clinical case study is an analysis of someone receiving psychological therapy, which often is provided in a health center or clinic. Psychologists generally describe their cases in written summaries; clinical case studies, then, typically produce qualitative data.
A second type of research that can produce qualitative data is an observational study, in which researchers observe people’s behavior from a distance without interacting with them. A researcher might, for example, sit inconspicuously in a school playground and observe friendly and aggressive behavior among schoolchildren (Ostrov & Keating, 2004). Although the results of an observational study can include numerical data (such as number of aggressive incidents), researchers commonly summarize their observations in written reports, yielding qualitative data (Polkinghorne, 2005).
Do you think you might ever have unknowingly participated in an observational study?
In one observational study, a researcher provided compelling evidence of differences between rich and poor neighborhoods (Zimbardo, 1970). He parked two similar cars in different locations—
In an observational study, the psychologist does not interact with the research participants. However, in a different type of qualitative study, called a community-
The data in community-

THINK ABOUT IT
The observational study of the fate of cars parked in urban and suburban neighborhoods was conducted many years ago. Do you think you would observe similar differences between urban and suburban neighborhoods today?

63
DISADVANTAGES OF QUALITATIVE DATA. Despite their virtues, qualitative methods have drawbacks. Disadvantages lie in precisely those areas where numerical methods are advantageous.
With qualitative data, comparison is difficult. Suppose you read two case studies by a therapist and want to compare the people; you might ask, “Which of the two experienced more severe psychological distress?” Qualitative case studies provide no simple answer of the sort you would get from a quantitative measure.
Qualitative methods also are not concise. For example, an American psychologist once studied an individual’s personality qualitatively, by analyzing letters written by the person over a period of more than a decade (Allport, 1965). Interesting though it may have been, the resulting qualitative personality analysis was not concise: a book of more than 200 pages, describing only one individual. In addition, gathering such qualitative evidence is such a slow and labor-
Because words are open to interpretation, qualitative methods also lack precision. Different speakers, with different personal and cultural backgrounds, may assign different meanings to the same word or phrase. In contrast, numbers are a “universal language” whose meaning is understood precisely.
Finally, qualitative data leave open the possibility of bias. When conducting a study, researchers commonly hope that the results are consistent with their own theoretical ideas. If the data are quantitative, researchers face unambiguous numerical facts that may disconfirm their hypotheses. But when the data are qualitative, they need to be interpreted, and the researcher’s hopes may bias the interpretation. One of the most famous sets of investigations in the history of psychology has been criticized on these grounds. Sigmund Freud (1923) developed a theory of personality (see Chapter 13) based entirely on qualitative case-
These disadvantages are substantial. As a result, most psychologists opt for quantitative rather than qualitative evidence. As we now turn to questions of research design, the studies we discuss will almost exclusively involve quantitative data.
WHAT DO YOU KNOW?…
Question 13
Which of the following statements are true of qualitative research methods or evidence? Check all that apply.
- fGish4hhgoPw+hDAoJSg2yXW8KxlbCrsfYiXwFRQJLqHlTD+j8xzF+qCT+SgX69ZKXK4Ly0RYygWPOtrhGpkskzTllwXcnDzC4gLD6+zm4f6CpWT+qmYunca+brhWkRWglRDVh+ZkILg4DdF2C7BretX8EYbIPjofmE8R8xNIAw7EINo
- Re9G08OZcImLaC4lsXtuGnGoa/KuajBH6XBbms2TJ6D7/1X4mka/Qvzu1dZNxKefqHxf/LXn7jX5UgM/az6BZlY8m5CekvS8lnRmtXbYn1o7IMDo
- LDOw8GuYVAqOA9jeZaMnXCacq0tkddmxOvJukS4VQ2dzd70I9Z//m0fAIWOu1eMzcF+4wGwWoAI57U9S7mN7Qoth5n/s+mgyGSNAXtyrb1kQiSVESrZ9dN2SBoMXkxgxIPQg4XA+eXFVFA9JLfnqDBrUzbmiJoT4rtIPyHPZE4RjzgVrLRJmVwHSFo2jIN4rv7YQcQSifk2RC4FrupOyMwJLaIKuC8gOTc24nA==
- jlT+DiIU+lnjAvQ2RDkcdAG6ZzQWuG22AYI9TsWfO7vyNLQje4lZTML7THqVhdEs0xOAvRhups1x3QCpojtubdUO5r2PGxnwpa4nZlTmIMH09GHr
- bD5YHnuLMohzwjBHLMKc4Qid6ZADYZPeQz75PrZykvMDDZhgW0F0pdhE2O6yOovYpsTEKUkoWAHTe3EOhadw9PQzXGzX+yc+WMKW7dwo7sKROvPF
64
TRY THIS!
The next section of this chapter discusses research procedures that psychologists use to obtain their scientific evidence. Before reading about these procedures, experience one for yourself. Go to www.pmbpsychology.com and try your hand at the Try This! activity for Chapter 2. Do it now! We’ll discuss the activity a little later in this chapter. ![]()