5.3 The Visual System
“I saw it with my own eyes!” “Seeing is believing.” “I’m from Missouri, the Show Me State.” When we need reliable information, in vision, we trust.
Visual Perception
Preview Questions
Question
 How are we able to perceive depth even with one eye closed?
Question
What are the advantages of having two eyes?
Question
How does the visual system enable us to perceive motion?
Question
How do past experiences and current context influence perception of shape?
163
Question
What does it take for us to notice whether someone dimmed the lights?
Question
How does our attention to the overall environment enable us to experience color?
Question
Do colors have opposites?
The visual system delivers four different types of information, namely, information about (1) distance and size; (2) motion; (3) shape; and (4) brightness and color.
DISTANCE AND SIZE. Stop reading for a moment and look around your environment. (But don’t forget to return to the reading!) No matter where you are, you’ll immediately notice that some objects are closer than others. Your phone is nearby. A car seen through a window is farther away. The window is closer than the car but farther than the phone. The perception of distance—
Before we answer this question, note how distance relates to perceptual information about another feature of the world: objects’ size. Judgments about size are not determined solely by the amount of space an object takes up in your visual field, which is the range of the potentially observable world that can be perceived at any point in time. If you make a circle with your thumb and forefinger and look through it at the moon, your fingers take up more space in your visual field than the moon. However, you perceive the moon as bigger because you also perceive it as very distant.
To judge distance and size, your visual system uses cues to depth, which are sources of information that enable organisms to judge the distance between themselves and the objects they perceive. There are two types of depth cues:
Monocular cues are available to an organism even if it is using only one eye.
Binocular cues are depth cues that require two eyes.
What are two ways your life would be different if judgments of size were determined by the amount of space objects took up in your visual field?
To experience the power of monocular cues, look around your environment again—
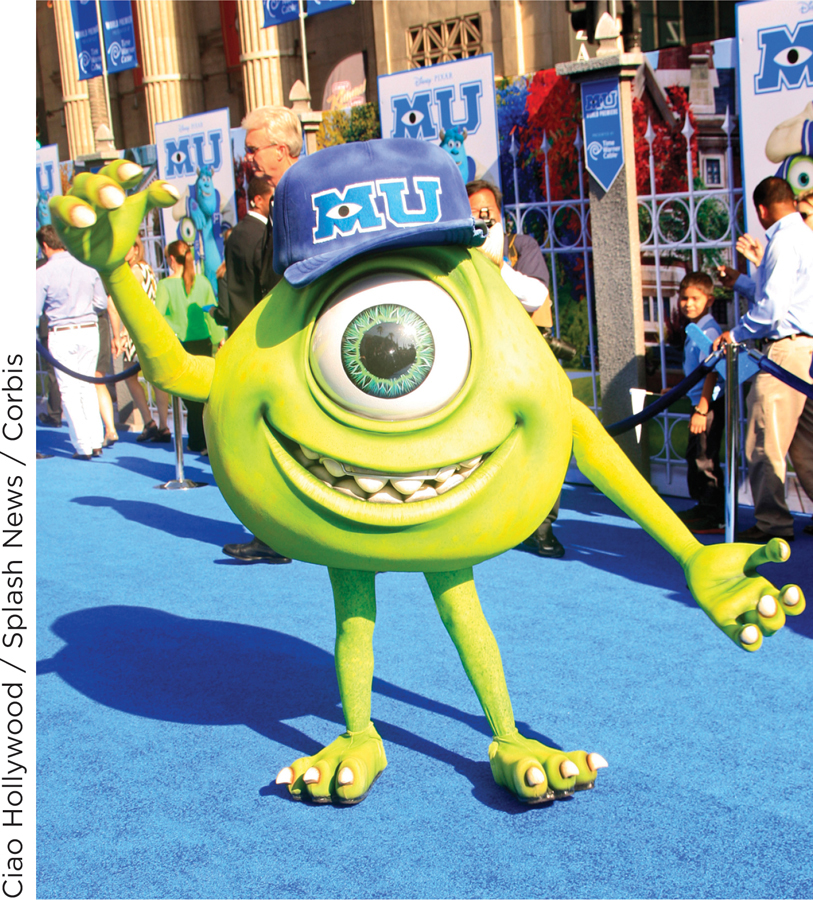
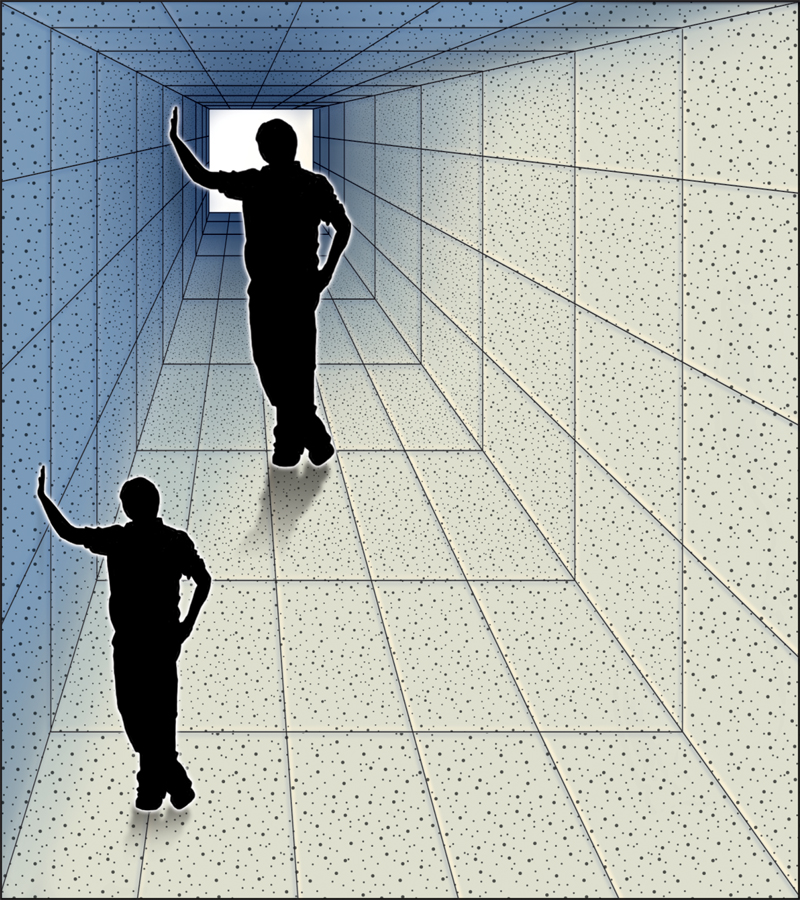
At first glance, the two people appear to be of different sizes: A big one behind a little one. But how different are they? If you measure them, you’ll find that their physical size on the page is identical. Yet you perceive that the monster on top is farther away and bigger. This perception is caused by your visual system’s use of two monocular cues:
Converging vertical lines: Vertically oriented lines that get closer to one another, or converge, create the perception of depth. This perception is based on our experience of the physical world. If you look down a roadway or railroad track, the two edges of the road or rails of the track converge visually as you look into the distance. Even when converging lines appear on a printed page, your visual system automatically conveys the perception of depth.
164
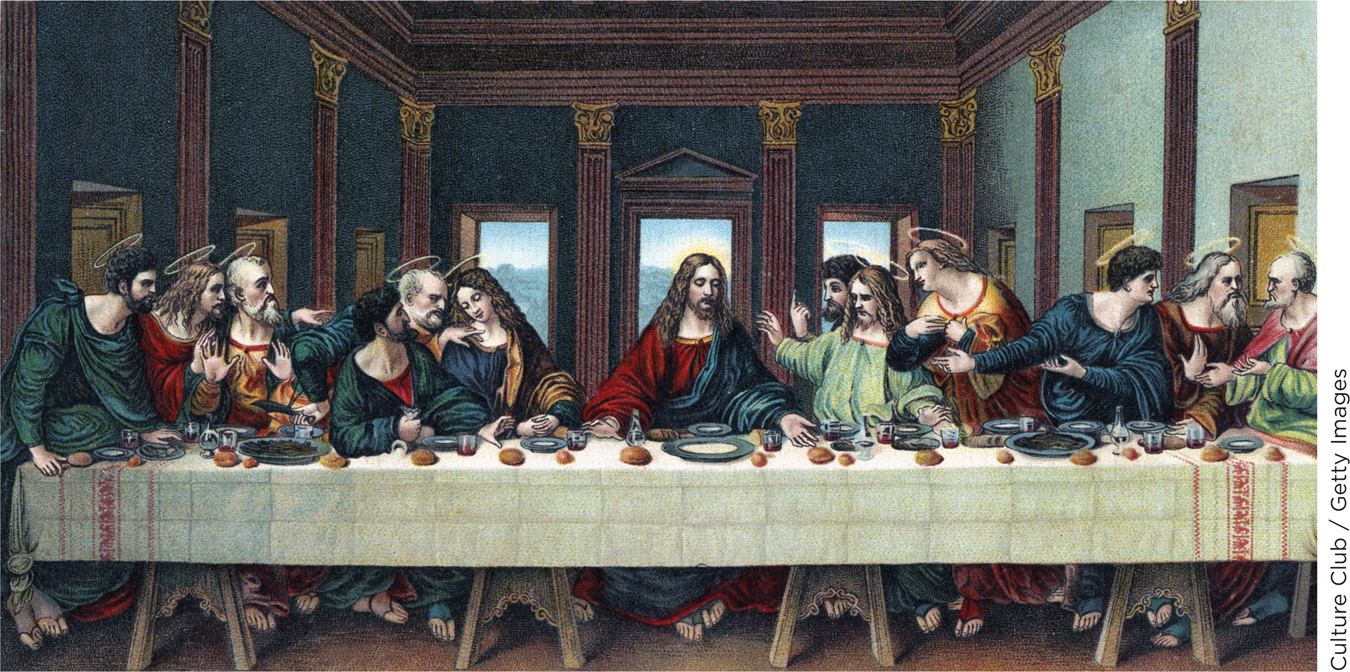 Leonardo DaVinci’s The Last Supper uses the perceptual cue of converging vertical lines to create a sense of depth.
Texture: Variations in visual texture, the various markings on the surface of objects in a visual scene, are a second monocular cue to depth. Imagine seeing a rough surface that extends into the distance—
for example, the rocks on which a railroad track sits. Looking at the rocks nearby, you can see the individual features and spaces between them. As you look into the distance, the rocks become indistinguishable “dots” and blur together. Figure 5.1 incorporates such variations in texture in the marks that portray the texture of the bricks. These contribute to the perception of depth.
In your elementary school art class, which monocular cues did you use to create the illusion of distance?
A third monocular distance cue is occlusion, a visual phenomenon in which one object partly blocks another from view. The blocking indicates that the first object is in front of the other—
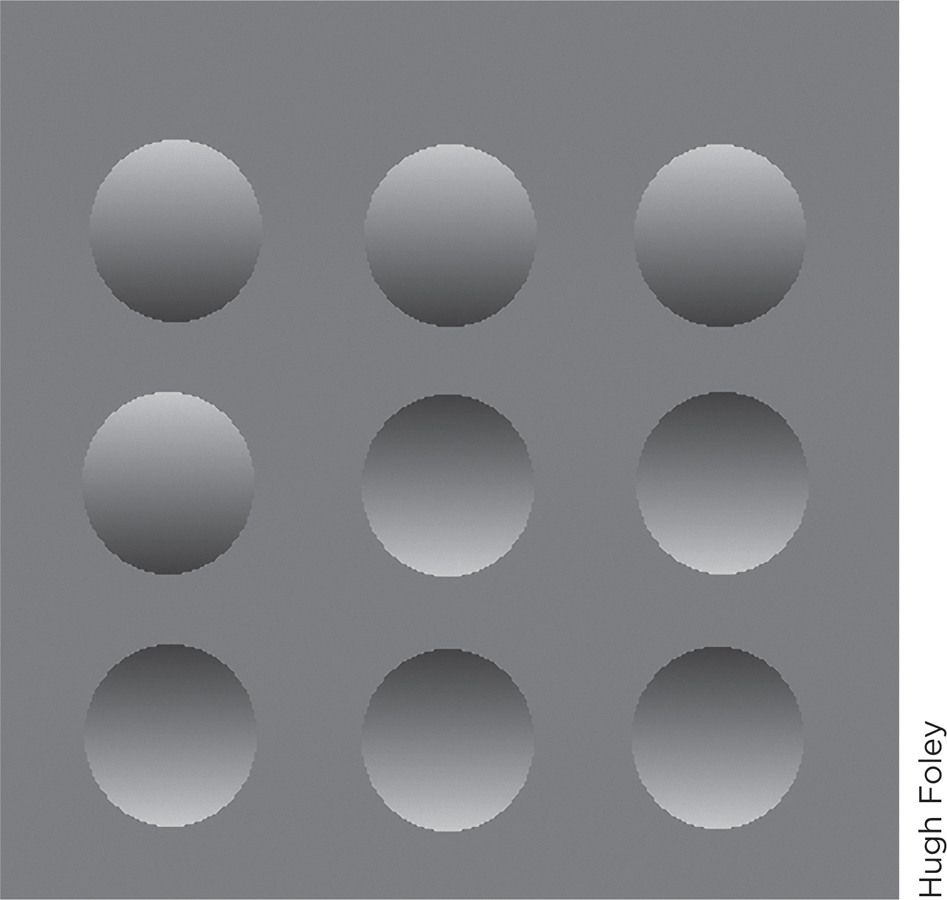
Another monocular distance cue is shading, which is the presence within a visual image of a relatively dark area that appears to have been created by blocking a source of light. Objects can appear closer to or farther from you based solely on how they are shaded. Look at Figure 5.3. Some of the circles seem to rise up above the square, and thus to be closer to you than is the square itself. Other circles seem to sink into the square, away from you. But none are actually closer or farther away—
Another monocular cue to depth is an object’s clarity, which is the degree of distinctness, as opposed to fuzziness, of a visual image. Clearer objects appear to be closer. In general, they are; you usually can see objects right next to you more clearly than those that are farther away. However, sometimes clarity varies while actual distance remains constant. If so, the variations in clarity can create an illusory perception of change in distance that is startling. If you live in an area with fog, mist, or smog, a mountain range can appear far in the distance. But if the atmosphere clears up, the mountain suddenly appears to have jumped forward closer to you.
165

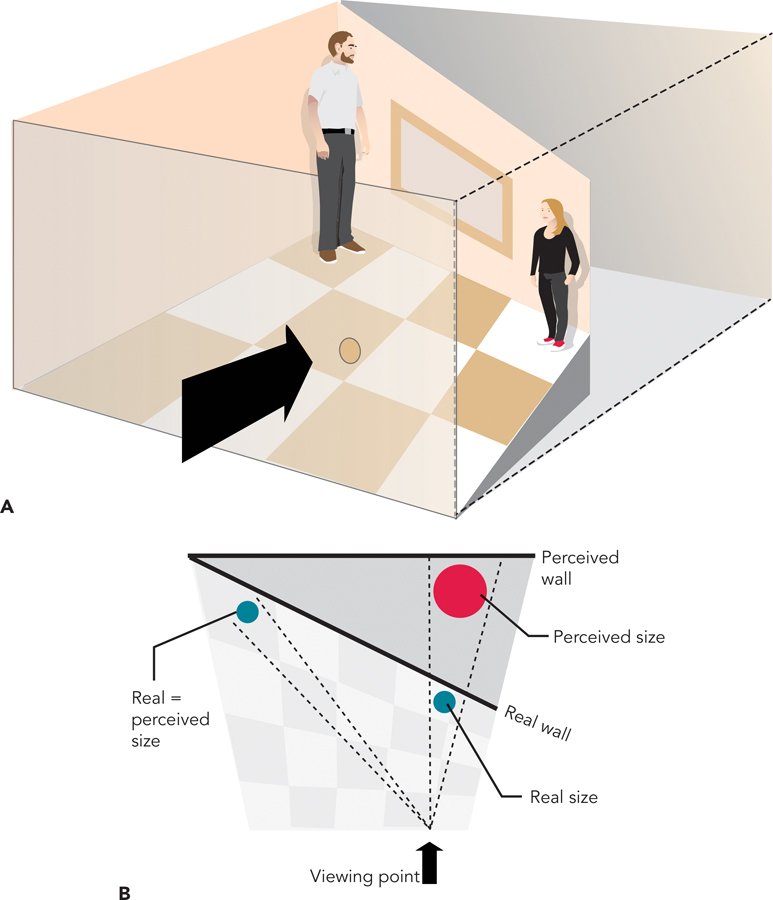
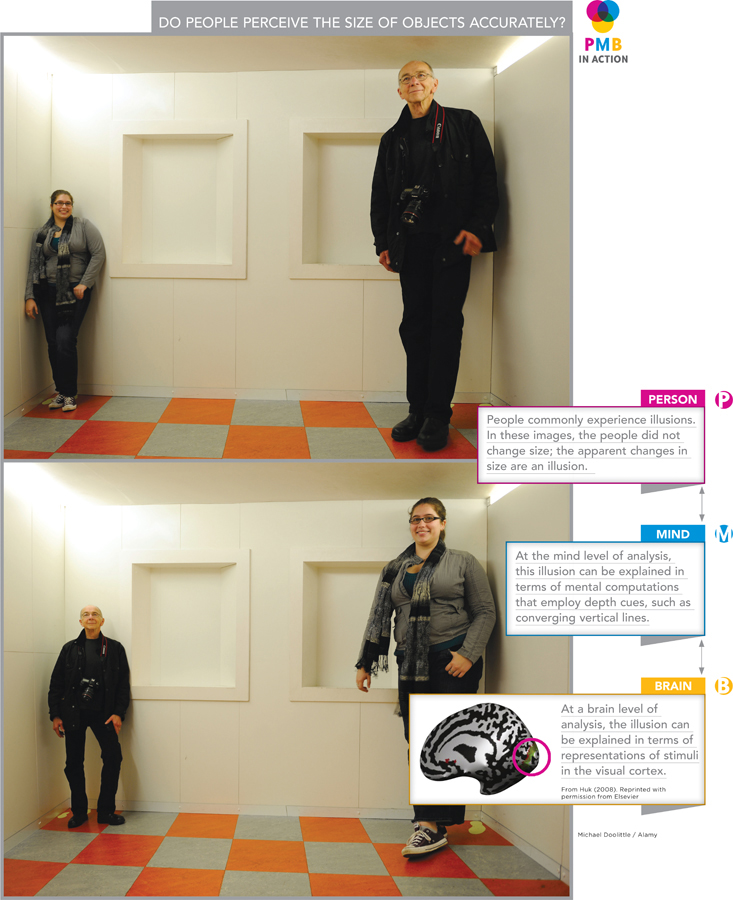
Finally, the perception of objects’ distance and size is affected by environmental context, that is, the overall set of visual cues in the environment in which the object is placed. The role of context is illustrated by the odd-
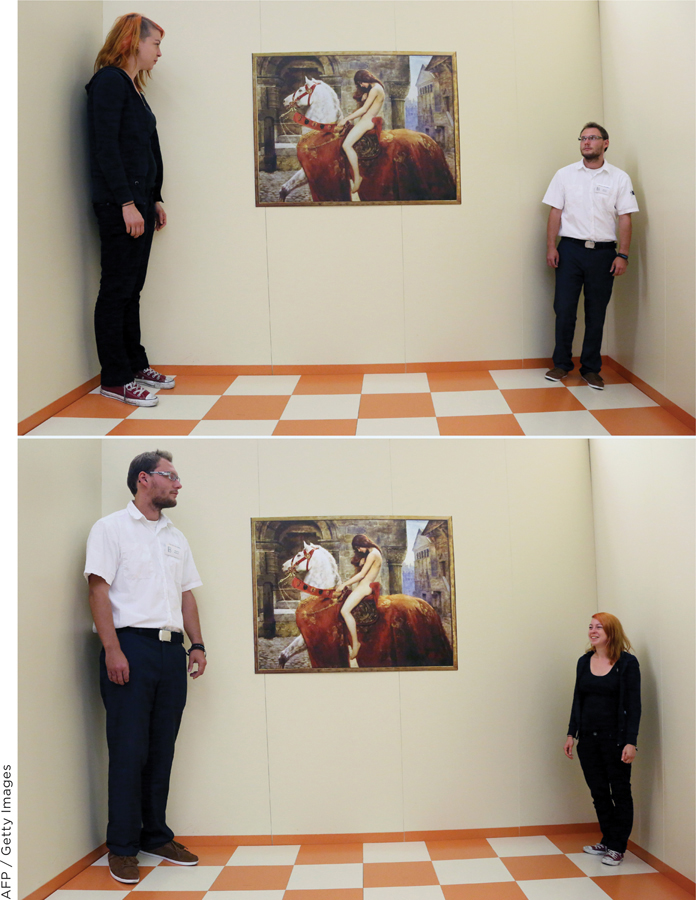
It turns out that the oddity is not the people but the room; it is an Ames room, an apparatus for studying the perception of size. Its key feature is that it is not cubic. As you can see in Figure 5.5, the wall slants back, away from the viewer. In addition, the floor and ceiling are not parallel; the ceiling height is higher on the left than the right. The room is designed so that it’s impossible to detect these deviations from a room’s typical cubic shape. Your visual system (1) assumes that a room (the context in which the people are viewed) is cubic and (2) interprets people’s height in light of this assumption (O’Reilly, Jbabdi, & Behrens, 2012). The only interpretation that fits the assumption is that the people on the right are big.
166
With all these monocular cues to depth, you might wonder why we evolved to have two eyes. Binocularity has its advantages. With two eyes, organisms have a “spare”; vision is maintained even if one eye is injured. Two eyes also provide a wider visual field; organisms can take in more information with two eyes than one. In addition, binocular vision provides more accurate depth perception (Bingham & Pagano, 1998), thanks to two binocular cues to depth: stereopsis and convergence.
Stereopsis is the perception of three-
167
Convergence is a depth cue that involves the muscles that move your eyes. When you look at close objects (e.g., a few inches from your face), your eye muscles must exert effort to focus your eyes on it. If the object gets ever closer, more muscular effort is required to make your eyes converge. Feedback from these muscles to your brain provides an extra source of information about the distance of objects (Wexler & van Boxtel, 2005).
You’ve learned about a wide range of cues to depth. Table 5.1 summarizes them for you.
| Cues to Depth | |
|---|---|
| Monocular Cues | Binocular Cues |
|
Converging vertical lines |
Stereopsis |
|
Texture |
Convergence |
|
Occlusion |
|
|
Shading |
|
|
Clarity |
|
|
Environmental context |
|
5.1
People who have trouble turning their eyes toward each other may suffer from convergence insufficiency, a treatable disorder of the binocular vision system.
CULTURAL OPPORTUNITIES
Perceiving Absolute and Relative Size
Here’s a simple perceptual task. You’re shown the design labeled “Original”—a square with a vertical line in it (Figure 5.7). This image is removed, and you then see a square of a different size than the original square. It has no line in it. The task is to draw one of two types of lines: one whose (1) absolute length is the same as the original, or whose (2) relative length (i.e., relative to the size of the square) is the same as the original. (The lower two images show lines drawn accurately under these two instructional conditions.) Now here’s a question for you: What’s this task doing in a textbook feature about culture?
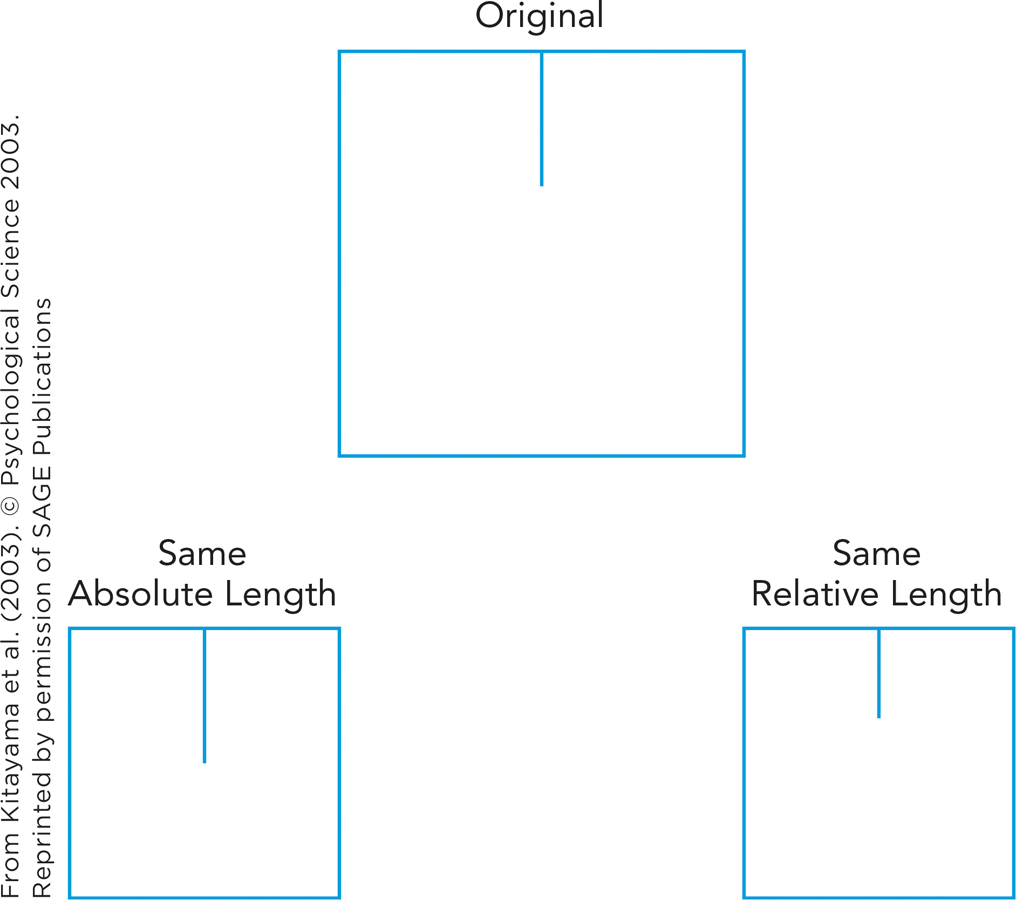
168
It turns out that people in different cultures perform differently on the task. The graph shows the average magnitude of error (the difference between the line drawn and the correct line length) for two groups of college students: Japanese students at Kyoto University, in Kyoto, Japan, and American college students at the University of Chicago in Illinois. Japanese students made smaller errors—
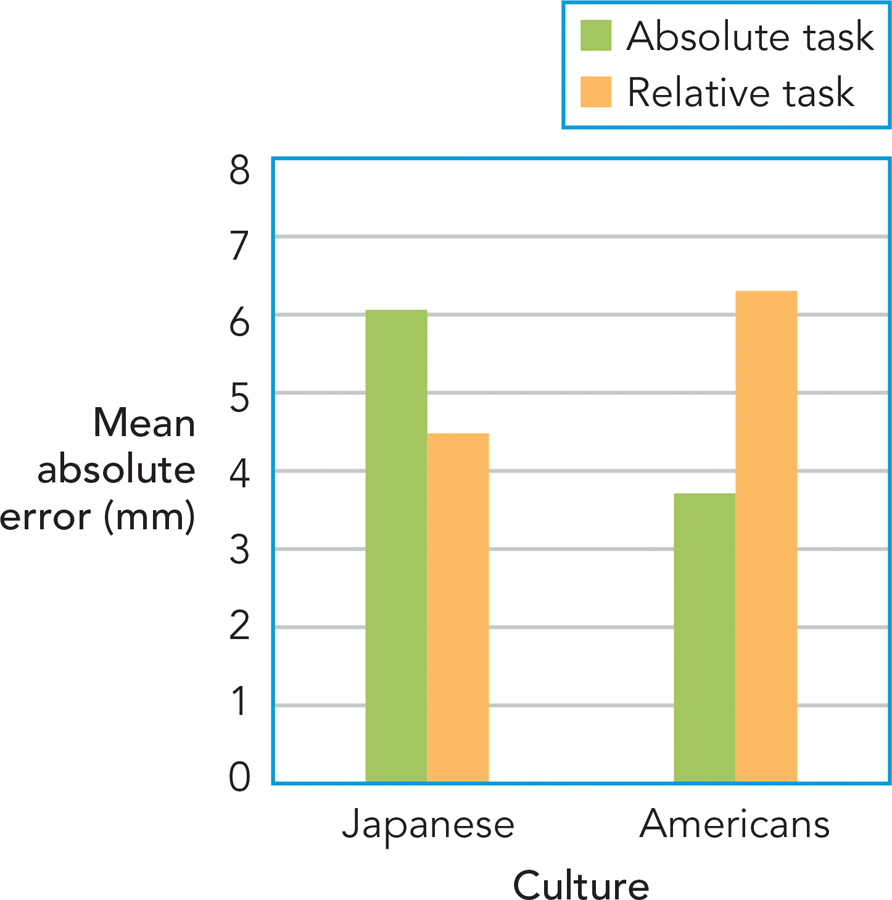
These differences in perception and performance reflect a more general cultural difference in “analytic” versus “holistic” perception (Nisbett et al., 2001). Cultural practices in North America promote analytic thinking in which objects are examined in terms of their distinct parts. U.S. students, having grown up with these cultural practices, are particularly good at isolating a distinct part of a figure—
The results show how the mental process of perception can be fully understood only by considering the person who’s doing the perceiving, and the culture in which that person lives.
WHAT DO YOU KNOW?…
Question 3
QNpjTPuQ3ku4x1g2Ekp+6NOHvIkRXOviTEgrTJzhIUQa6wP7fRfiLHCgA42UAl8x/gbqTzEel8GEKlu2CVaYzuaRF0vkUtQY/f0yfN5Ly2gV1hUB0hWYSE6TlkBH66GcqA0p2/OUC3CXqku2F29XEe3KMRjIXTj0l69OJGRull2WIcKjLvlCV8MKtIbgf5FZZbrRL3USvk8bqmsJ9werH67mFsPPDwpAHMC6ucEq/lgMFXbup/+Y0aUPTbl9HbvL9x52MQ==PERCEIVING MOTION. In addition to size and distance, your visual system delivers information about motion. This information is of two types: relating to (1) the movement of objects in the environment (with respect to you, who are not moving), and (2) your own movement through an environment (which is stationary). Let’s consider them in order.
People are very good at perceiving the movement of objects. Even slight movements are detected immediately. If you were to hold this book in front of you at arms’ length, the amount of movement required for you to notice that motion occurred is no larger than the tiny space between two letters on this page (Sekuler, Watamaniuk, & Blake, 2002). People also are good at detecting where objects are going and how fast. In perception research, participants rapidly detect even quite small variations in the direction and speed of stimuli, such as dots moving on a computer screen (Sekuler et al., 2002).
THINK ABOUT IT
Do you think you perceive motion when images on your retina (the back of your eye) move? How can that be? If you move your head while looking around a room, the images of the room on your retina move, but you do not perceive that the room is moving.
169
The visual system is so inclined to detect motion that we sometimes perceive it even when it’s not occurring. In the phi phenomenon, observers view two (or more) objects that are stationary but flash in an alternating sequence. What they perceive is not stationary flashing objects, but motion; the display appears to viewers to consist of one object that moves from one location to another.
Motion also conveys information about the type of object that is moving—
For centuries we have thought of the retinal image as a picture projected and focused on a screen, the image being mobile and the screen fixed. The image is supposed to be freely transposable over the retina. But actually it is the other way round. The image is perfectly stationary, being anchored to the world, and the retina moves relative to the image.
—James J. Gibson (1968; pp. 337–
Now imagine a different case: The objects in your view are stationary, but you are moving—
The images that reach your eyes are in motion, yet the environment appears stable. Every time you take a step, the images that reach your retina—
for instance, images of nearby trees— jump around, as a result of your body’s movement. Yet you don’t think, “Man, look at those trees go!” Your visual system correctly tells you that the environmental objects are stable, even though their images on your retina are moving. This means there is no one- to- one correspondence between movement of light at your retina and your perception that objects in the environment have moved. 170
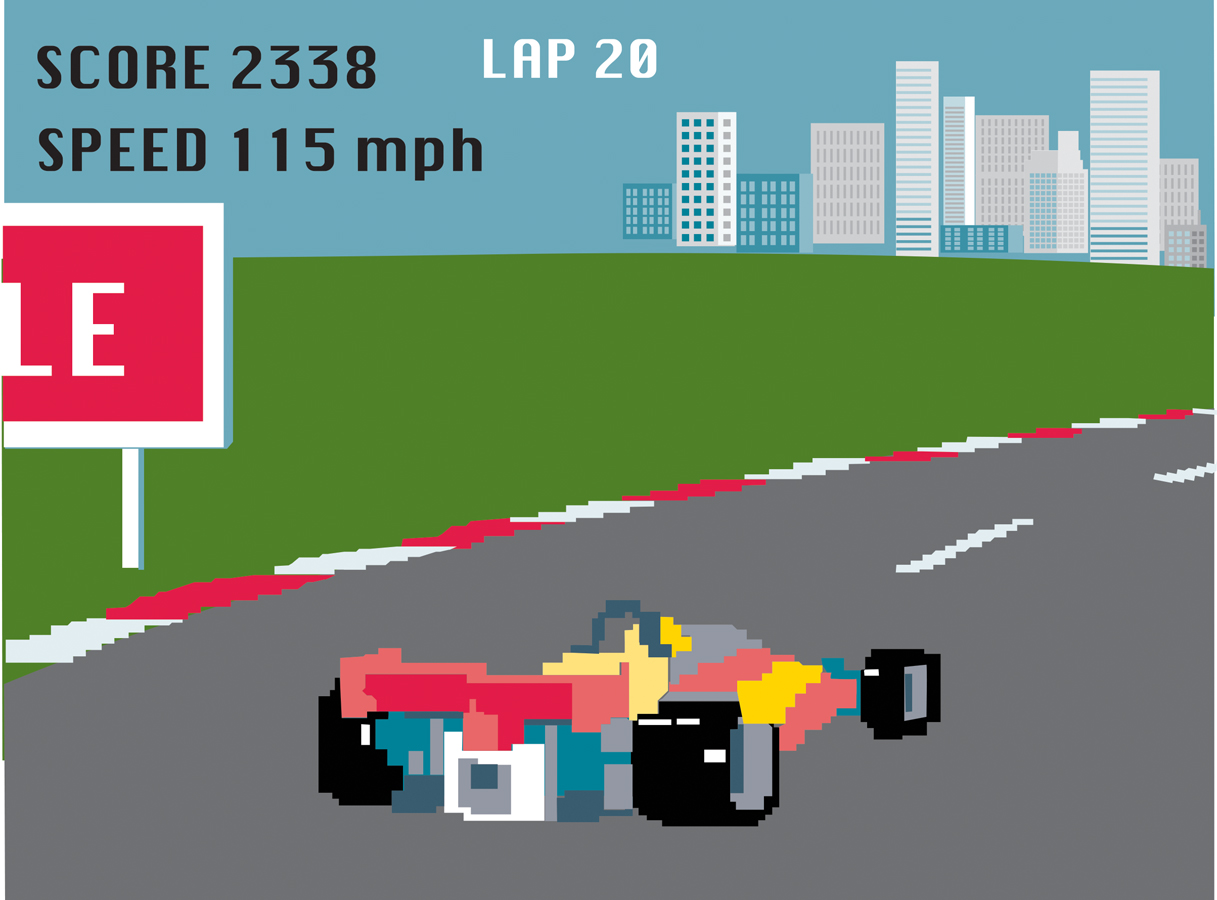
When you move through the environment, you experience a systematic flow of visual images. As you jog, images of objects change at different rates of speed. Images of nearby objects (e.g., the ground below you) flow past rapidly, whereas images in other regions of your field of view (a hill in the distance) change much more slowly. The psychologist James J. Gibson emphasized that this optical flow, the continuous change in visual images that moving organisms encounter, provides visual information about their movement. Video game designers capitalize on optical flow to create illusions of motion and depth (Figure 5.10).
TRY THIS!
Now that you have learned about the perception of smotion, it is time to take part in an experiment. Go to www.pmbpsychology.com for this chapter’s Try This! activity. We’ll discuss the experiment later in the chapter—![]()
SHAPE. In addition to distance and motion, your visual system also provides information about shape, that is, the outline or contour of objects. In fact, the visual system is so inclined to detect shape that you end up seeing shapes that aren’t really present. Look at Figure 5.11, which depicts a Kanizsa triangle, devised by Italian psychologist Gaetano Kanizsa (1976). You perceive a bright white triangle in the center, on top of another triangle and three black circles. But in the open area in the center, no lines exist; in other words, there is no bright white triangle—
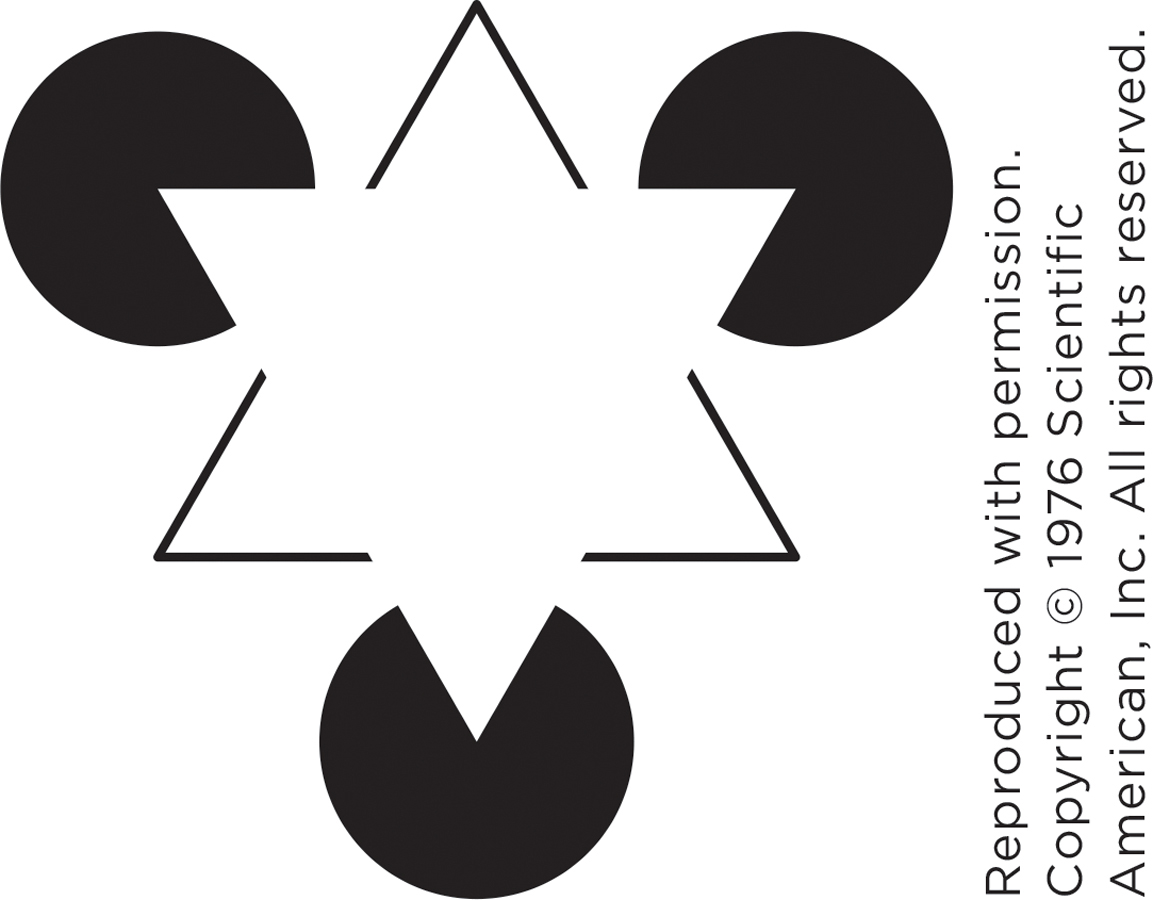
Note also that the image does not explicitly show a triangle or circles underneath the bright white triangle. The drawing merely depicts three V-
171
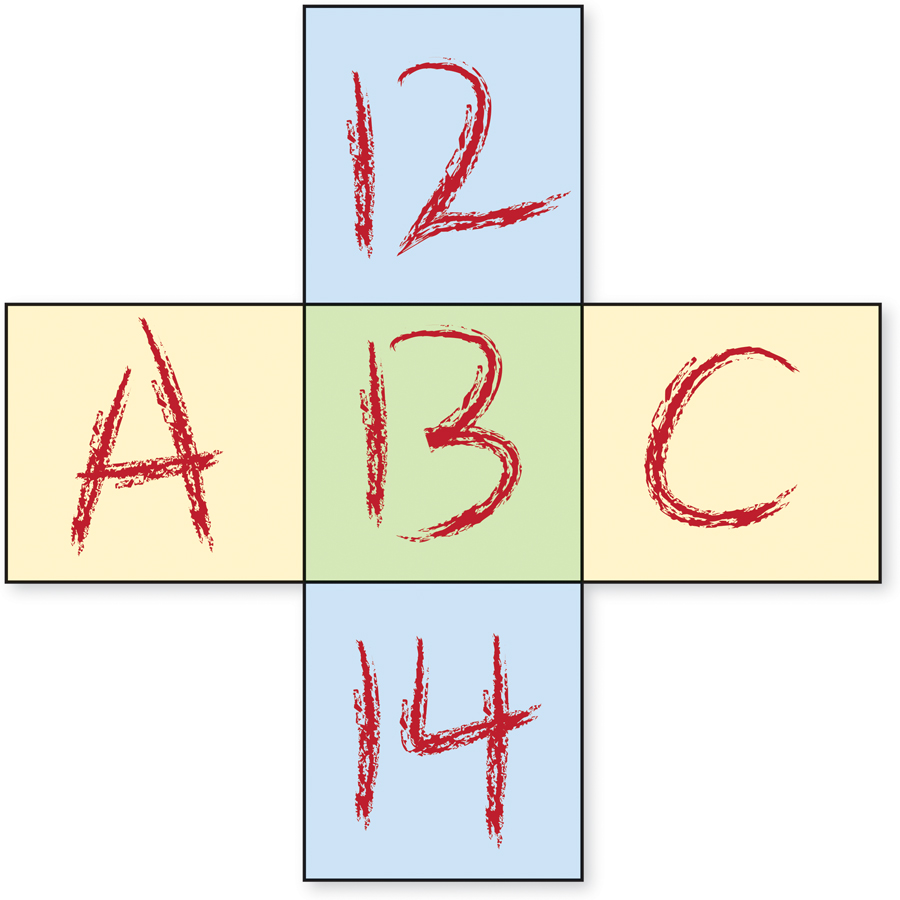
Your visual system’s interpretation of shapes depends on the context in which they occur. The middle box in Figure 5.12 displays a vertical line next to a curved “m” shape on its side. What do you see? If you read up-
Sometimes your visual system does not know precisely “what to do with” shapes and their contours. Some figures, in other words, are open to two interpretations, and the visual system “flips” back and forth between them as it struggles to make sense of the environment. The edges of the vase in Figure 5.14 can also be perceived as the outline of a human face in profile. Your varying perceptions of the vase illustrate the principle of figure-

172
BRIGHTNESS AND COLOR. In addition to information about distance, motion, and shape, your visual system provides information about brightness and color. Human vision is extremely sensitive to these visual qualities. Cells in your eyes respond to the smallest possible amount of light, that is, one photon (the basic elementary unit of light; Rieke & Baylor, 1998).
Your visual system detects not only light’s presence, but also variation in its brightness (e.g., if room lights brighten or dim). How much change is required for you to notice? This is a question about just noticeable differences. A just noticeable difference (JND) is the minimal variation in a physical stimulus (light, sound, etc.) that a person can detect. JNDs have been explored since the nineteenth century by researchers in psychophysics, a branch of psychology that studies relations between physical stimuli and psychological reactions.
What, then, is the answer? How much change in light is required for you to notice? It turns out that there is no one fixed answer. Instead, it depends. With a bit of thinking, you can figure out for yourself what the answer depends on. Compare these two circumstances:
You’re in a room illumined by only one candle, and someone standing behind you lights a second candle. Will you notice the change in illumination?
You’re outdoors on a bright sunny day, and someone standing behind you lights a candle. Will you notice the change in illumination?
In both cases, the amount of change is the same: the light of one candle. But in #1 you notice the change and in #2 you don’t. In other words, in #1 the light of one candle exceeds the JND and in #2 that same light is less than the JND. The lesson is that the JND is not constant; its value depends on how much light is already in the environment. If a lot of light is present, then a bigger change in illumination is needed for you to notice the change in brightness.
In what way could your current context be affecting perception of a nearby object?
Your perception of an object’s brightness depends on not only light coming from that object, but also light coming from nearby objects. The visual system responds to the contrast between brightness in different areas of the visual field. Figure 5.15 illustrates this. It appears to display a dark gray square on the left and a light gray square on the right. But those two squares are identical! The perception of their difference is caused by their contexts: The left square is much darker than its surrounding context and thus is perceived as darker than the square on the right.

173
Now let’s consider the perception of color. We need to begin with the physics of light. Visible light is one little sliver of the overall electromagnetic spectrum, which is the full range of physical energy that is made up of electricity and magnetism. Electromagnetic energy exists in the form of physical waves. The waves vary in wavelength (Figure 5.16). Many long (e.g., radio waves) and short (e.g., x-
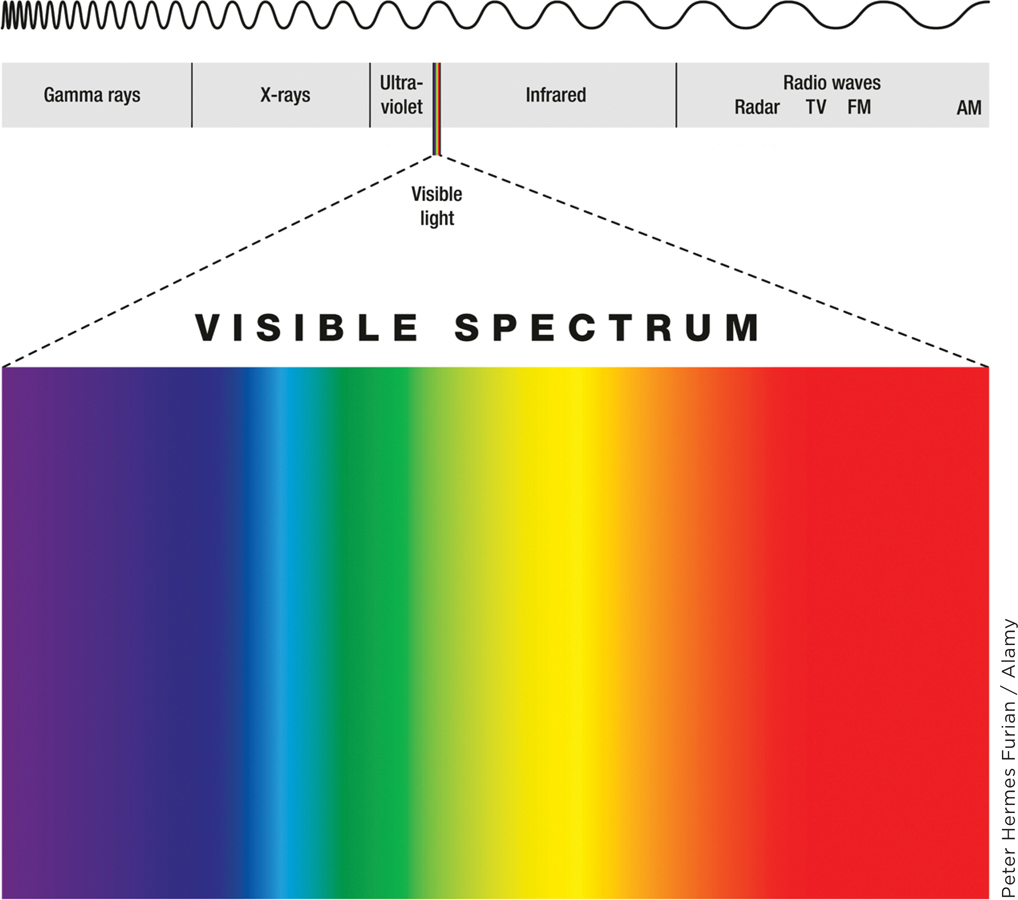
Within that region, variations in wavelength correspond to variations in color. The shortest detectable wavelengths appear violet, and the longest are experienced as red. Note that the color is not present in the light itself; light energy is not literally “colored.” Color is a psychological experience that occurs when the visual system is activated by light energy.
Wavelength does not entirely determine the psychological experience of color. We know this because wavelengths and color may fail to correspond in two ways: (1) Sometimes different wavelengths of light are experienced as the same color; and (2) sometimes the same wavelength of light produces, in different circumstances, different color experiences. Both phenomena are shown in Figure 5.17.
In panels (a) and (b), the apples look roughly the same: a few red apples nestled between some yellow and green fruits. The light reaching your eye from panels (a) and (b) differs considerably, though, due to a bluish filter placed over the image in panel (b). You thus have the same color experience, red, despite varying wavelengths of light. The tendency for a given object to be perceived as having the same color despite changes in illumination is called color constancy.
In panels (b) and (c), the apples look different. The apples in (c) are strange-
The lesson here is that your visual system does not respond to individual points of color but to the visual environment as a whole (Shevell & Kingdom, 2008). This makes sense evolutionarily. The ability to perceive colors—
174
One last key fact about color perception is that colors have opposites. You can imagine a reddish brown but not a reddish green. Red and green are opposites. It’s easy to imagine a yellowish green but not a yellowish blue. Blue and yellow are opposites. Opponent processes in perception create visual experiences featuring two opposing color pairs: red-

Let’s now look more deeply at the biology of perception.
WHAT DO YOU KNOW?…
Question 4
Match the cues to distance and size on the left with the information about them on the right.
Question 5
The visual system is excellent at perceiving movement and ZtOiRqekbnrzZj2r—so good, in fact, that in the Kanizsa triangle, we perceive lines depicting triangles that aren’t there. The amount of change in light required for you to detect a change, also known as the mAXlA9AiOZt4BcYgtR+PK6Sjzu0HhtP+e+/MBqmNatU=, depends, in part, on the amount of light already in the environment. Thanks to B5WQVVZoaxE/SmKwJYvch6syNp4=, you can accurately identify colors in varying amounts of light. If you were to stare at a green image for a while, then stare at a white wall, you’d likely see green’s opposite, GCnZAOLkkfQ=.
175
From Eye to Brain: Biological Bases of Visual Perception
Preview Questions
Question
Through what biological process are we able to convert light energy into information that is sent to the brain?
Question
How is visual information processed once it reaches the brain?
Question
Given the complexity of visual information, how are we able to perceive objects accurately?
The first piece of biological machinery that enables you to see is, of course, the eye.
THE EYE. Four biological mechanisms near the front of the eye (Figure 5.20a) begin the work of visual perception: the cornea, the pupil, the iris, and the lens. The cornea is the transparent material at the eye’s very front. Its curvature begins the process of focusing light, to produce a sharp image of the outside world. The pupil is the opening through which light passes (Figure 5.20b). The size of the opening is controlled by the iris, the colorful structure that surrounds the pupil. The iris dilates the pupil (i.e., widens the opening) in dim light and constricts it in bright light. Finally, the lens is a second transparent biological mechanism that focuses incoming light. Unlike the cornea, the lens’s focusing mechanism is adjustable. Muscles in the eye adjust the flexible lens to sharpen images of objects at different distances. With age, the lens loses some of its flexibility, causing people to need supplementary lenses—
The inner volume of the eye is filled with a transparent fluid. Light passes through this fluid and reaches the retina, the rear wall of the eye, which contains a system of nerve cells that respond to light and send signals toward the brain.
As we noted in this chapter’s opening story about upside-
176
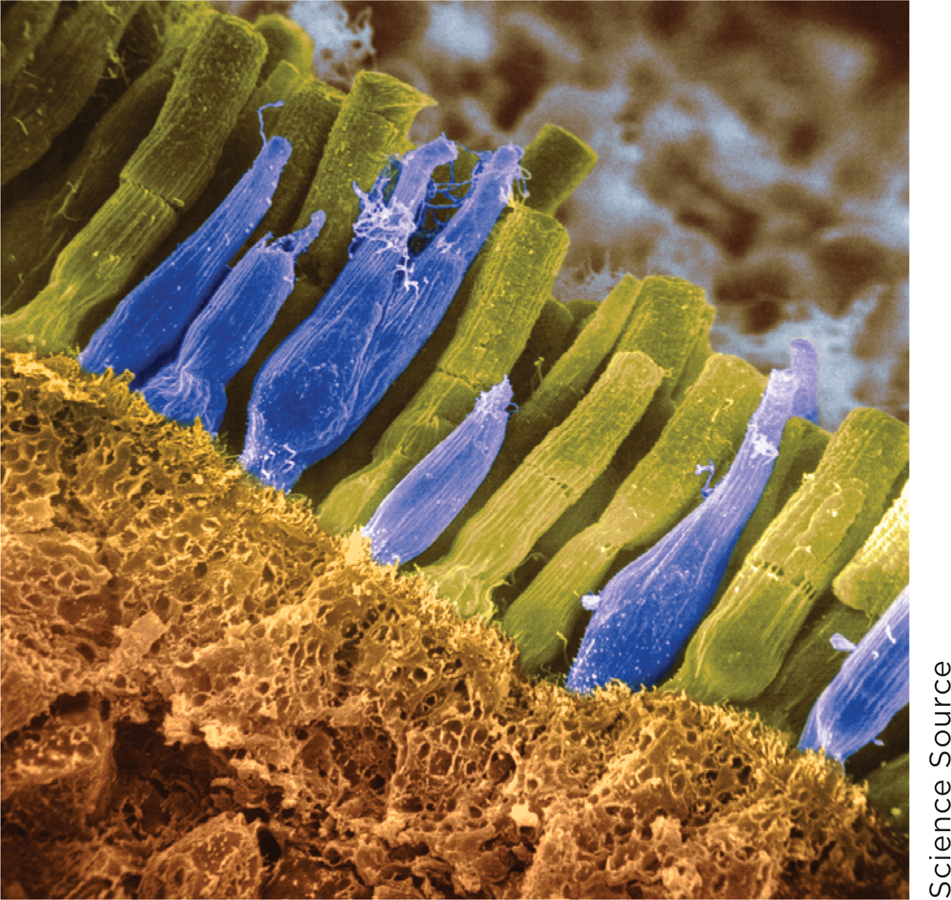
Once light reaches the retina, the body’s nervous system swings into action. The nerve cells that transduce light energy are called photoreceptors, as noted earlier in this chapter. The retina contains two types of photoreceptors, whose names reflect their shapes: cones and rods (Figure 5.22). An average human retina has about 5 million cones and 100 million rods (Winkler, 2013).
Have you ever had to use any of your “biological tools” differently, perhaps in response to a strain, sprain, or broken bone? How quickly were you able to adapt?
Cones are photoreceptors that provide two critical visual qualities: detail and color. Detail is possible thanks to a dense concentration of cones near the center of the retina, in a region known as the fovea (Curcio et al., 1990; Figure 5.23). You rely on the fovea, and its concentration of cones, when focusing attention to get a sharp, detailed look at an object. When you focus on any one object, you’ll notice that others, in the periphery of your visual field, appear blurrier and less detailed. Light from these objects falls outside of the fovea, where there are fewer cones.
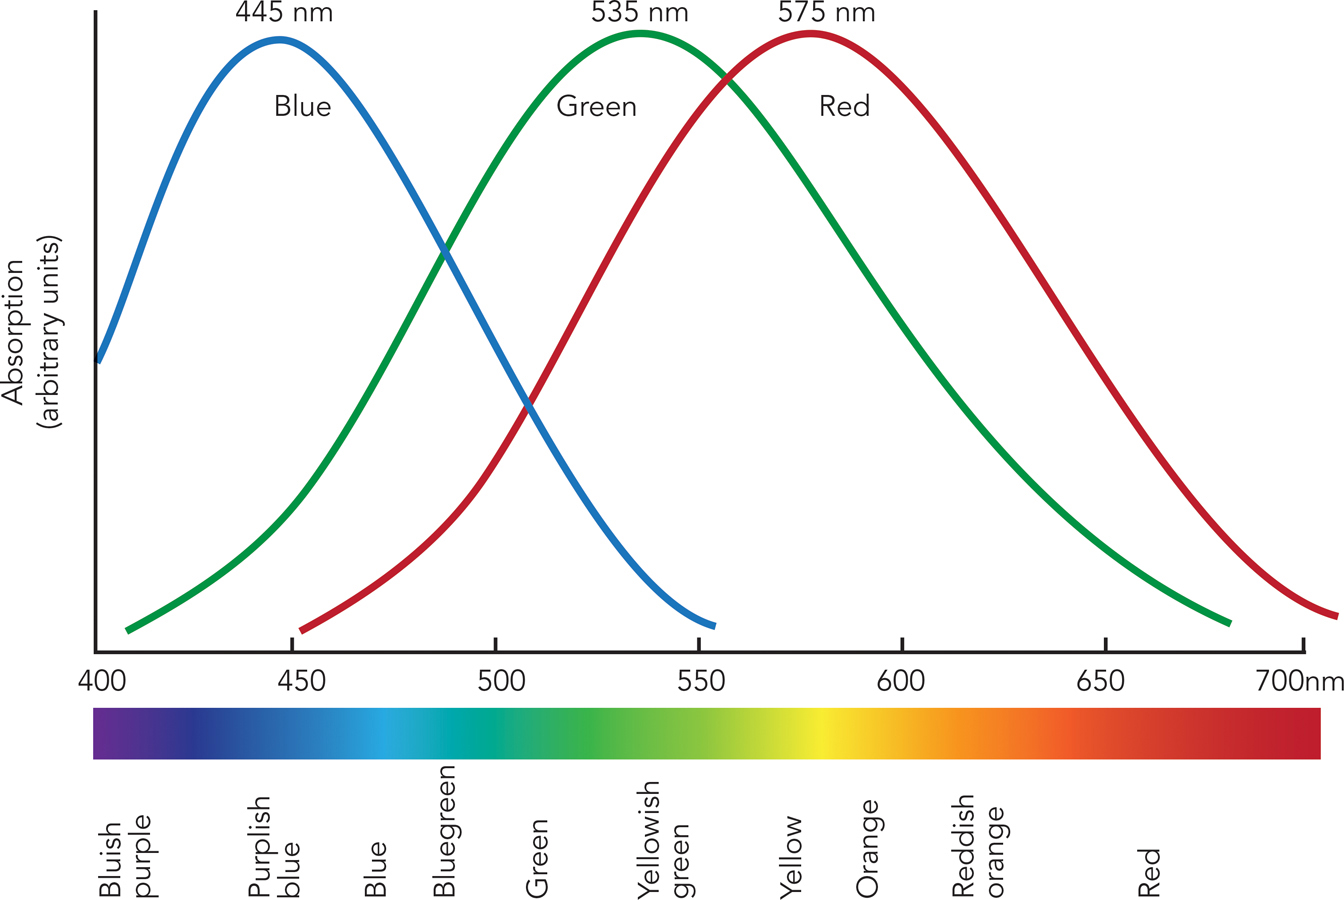
Cone cells also enable us to see in color. Different types of cone cells are sensitive to different wavelengths of light—
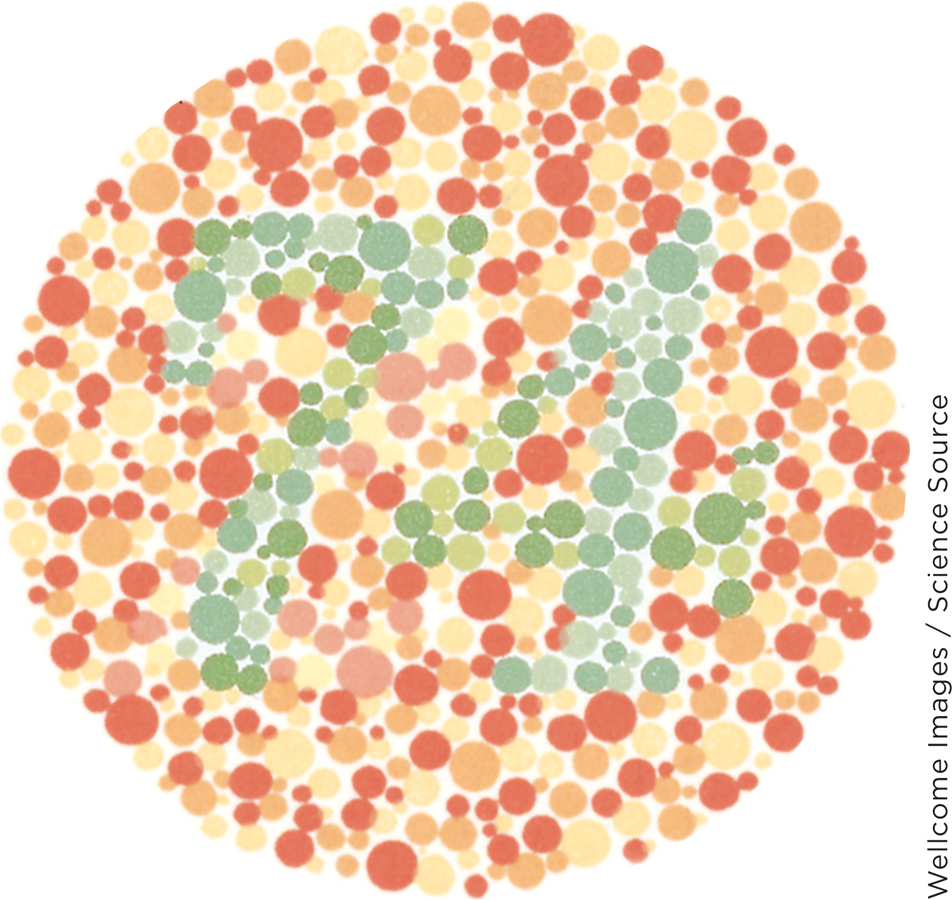
Due to genetic variations, some people lack normal functioning in certain cone types. The result is color blindness, an insensitivity to one or more of the colors red, green, or blue (Sharpe et al., 1999). If all of your color-
177
Rods are photoreceptors that enable you to see in low illumination. They are the receptors that, as noted earlier, can respond to as little as one photon of light; a cone cell, by comparison, requires about 100 times as many photons to become active. Thanks to the sensitivity of rods, you can see outdoors after the sun sets, or indoors when only a small light is on.
Although rods allow people to see in low illumination, they do not enable us to see color. Unlike cones, rods are not color sensitive. They do not respond at all to long wavelengths of light in the red range. You experience this at night; when the sun sets, the environment looks not only darker, but also less colorful, and red objects appear black. You do not, however, entirely lose your color vision at night. Research shows that, even if only rods are active, the visual system as a whole provides some experience of color, in part by making “educated guesses” about the color of familiar objects based on past experience of them in bright light (Pokorny et al., 2006).
The retina picks up most of its visual information during visual fixations, periods when a person’s gaze is held in one location. Fixations occur between saccades, which are rapid movements of the eyes from one position to another. A challenge for researchers is to track the rapid movements and fixations of a perceiver (see Research Toolkit).
RESEARCH TOOLKIT
Eye Tracking
People rarely just stare at one spot. Whether looking at a room, a face, or a landscape, people’s gaze shifts from place to place. The fovea takes in visual details during the fixations between shifts. This means that by measuring eye movements and fixations, researchers can learn how people interact visually with the world. But how do they measure eye movements and visual fixations?
178
The tool researchers use is an eye tracker, a system for measuring where people are directing their gaze across a given period of time (Raney, Campbell, & Bovee, 2014).
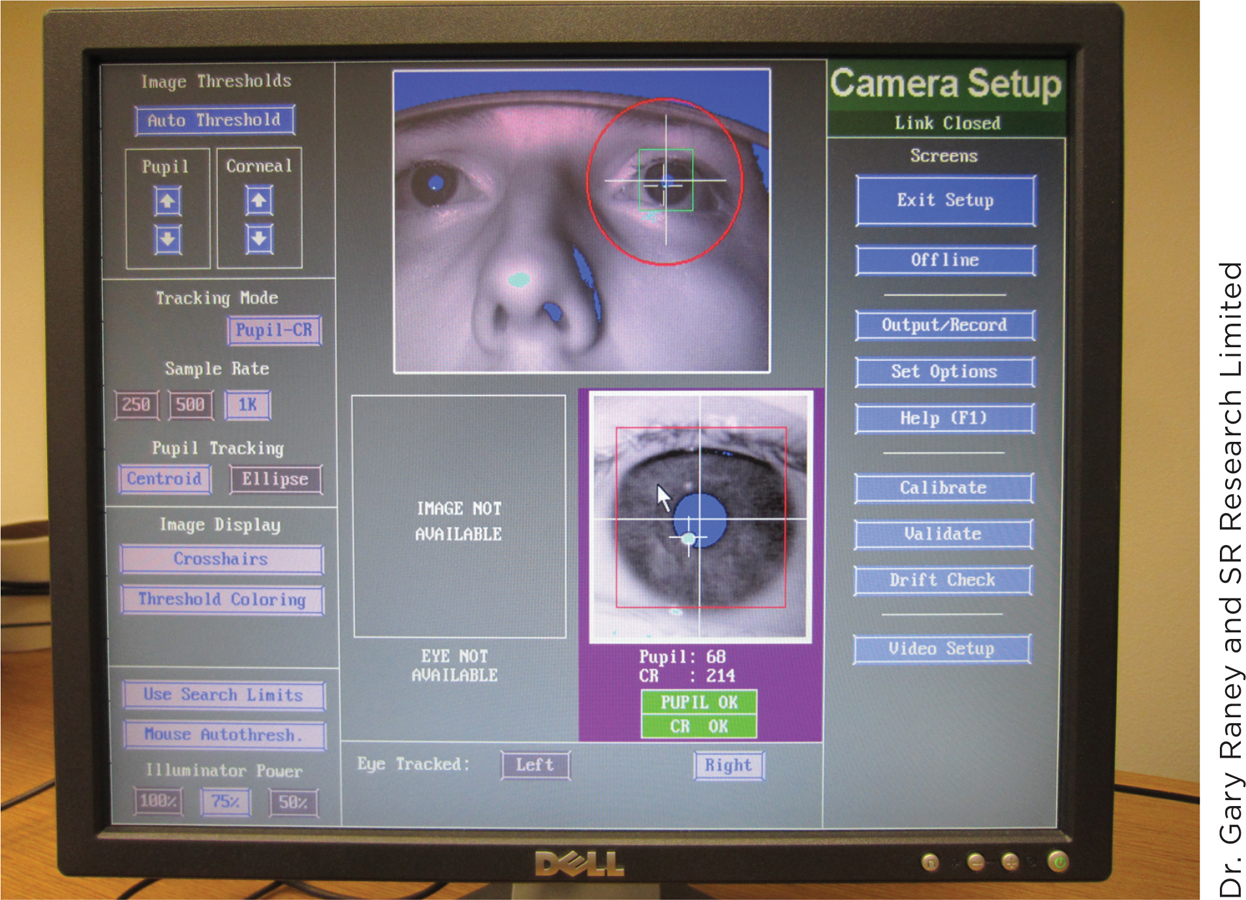
The most common eye tracking method relies on a phenomenon familiar from flash photography: red eye. Photographic red eye occurs when light from a camera’s flash unit enters people’s eyes, bounces off their retinas, and then returns to the camera. Because red eye occurs only if individuals are looking directly at the camera, its occurrence can be used to record where people are looking. In eye tracking, a light shines toward research participants while they view a stimulus (e.g., a picture or written text), and a camera records light bouncing off the backs of their eyes (Figure 5.26).
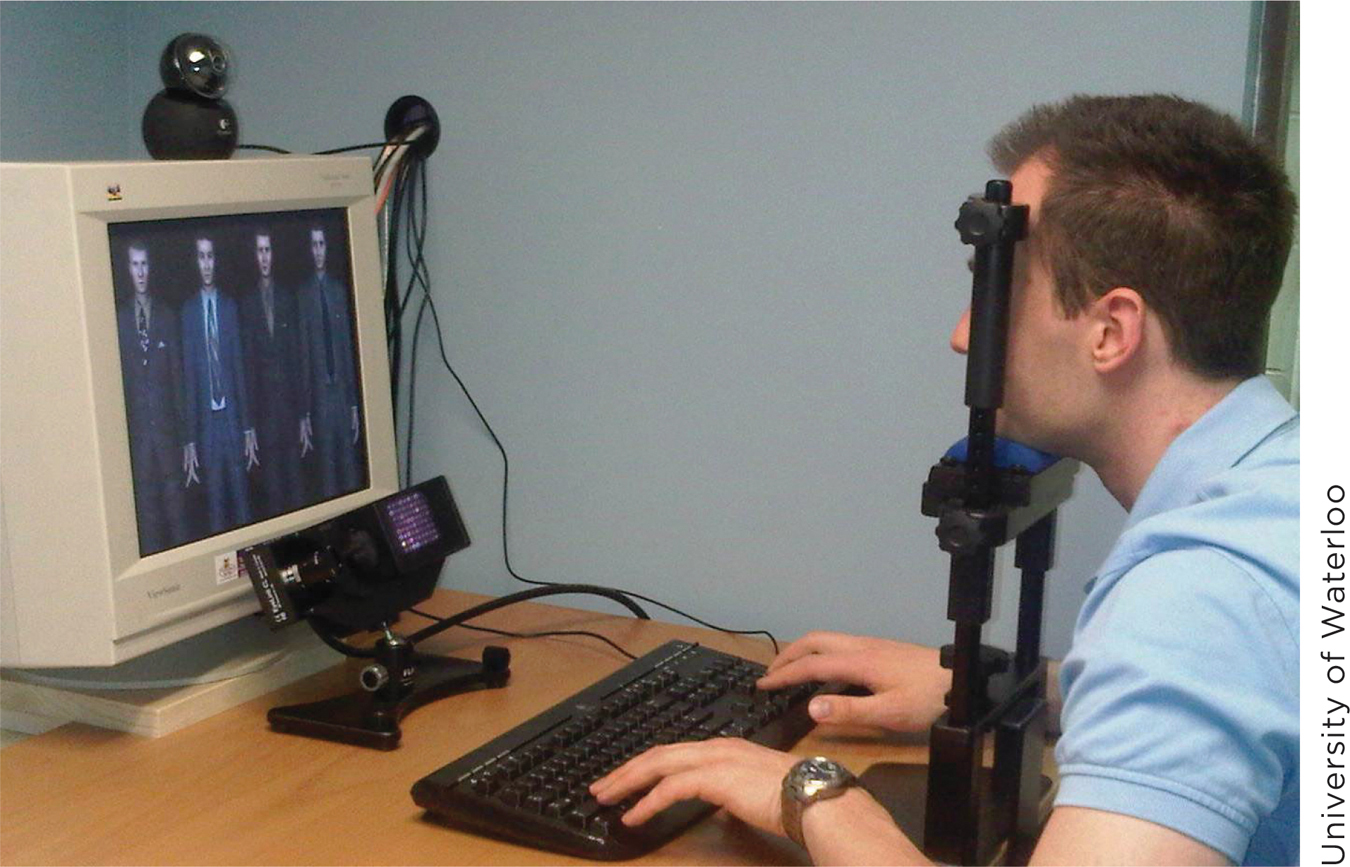
These recordings are the first of two steps in the eye tracking method. In the second, the eye-
In addition to their value in basic research, eye tracking methods can be used to answer practical questions. For example, Web designers want to know how people interact with information on Web pages: how long they look around, where they look first, where their eyes move next, and so forth (Cutrell & Guan, 2007). Eye tracking during Internet browsing provides this information. In Figure 5.28, the magenta coloring shows places on a Web page where users spent the most time directing their gaze.

179
WHAT DO YOU KNOW?…
Question 6
In the first step of the eye tracking method, the eye tracker’s camera records light that is bounced off the eyes’ 0b1hUNztHjytp5ei. In the second step, the tracker computes the direction and MRnd8HFR4jBEuU9WuEnUUbTVW0I= of eye movements during fixations.
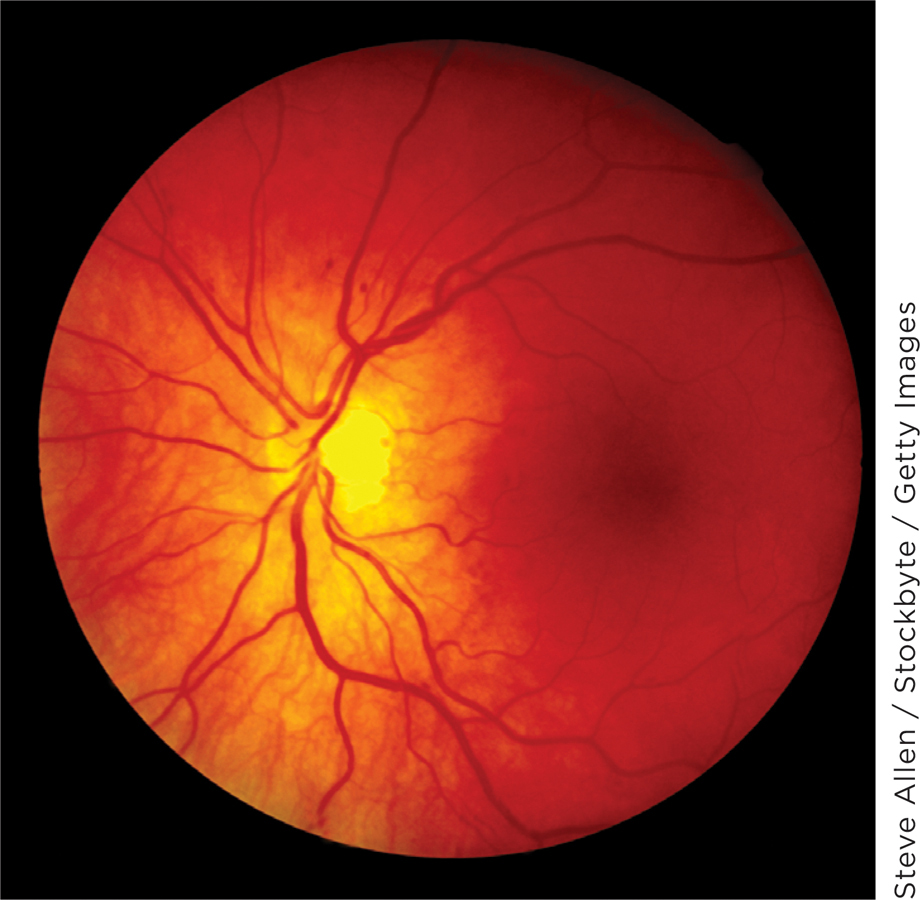
Once its cones and rods are stimulated, the eye’s job is to send visual information to the brain. Key to this information flow are ganglion cells, which receive information from the retina and transmit it into the brain. The long fibers of the ganglion cells, along which these signals travel, form the optic nerve (see Figure 5.20a). There are far fewer ganglion cells than there are rods and cones; each ganglion cell, then, receives and integrates information from multiple photoreceptors.
At the spot along the retina at which the optic nerve exits the eye, there are no photoreceptors. Light striking that spot thus creates no visual experience. It’s the blind spot—the location in the visual field at which nothing is seen. This might seem odd to you because, when you look around, you seem to see everything; you don’t usually experience a blind spot. Your brain normally “fills in” the blind spot, providing you with a continuous visual experience. But you can experience it—

FROM EYE TO BRAIN. The route along which signals travel from the eye into the brain contains three major steps. The first two involve the optic chiasm and the lateral geniculate nucleus.
At the optic chiasm, visual signals carried by the optic nerves cross (Figure 5.30). Information from the left eye crosses over to the right side of the brain, and vice versa. (This crossing is a general property of brain wiring; see Chapter 3.)
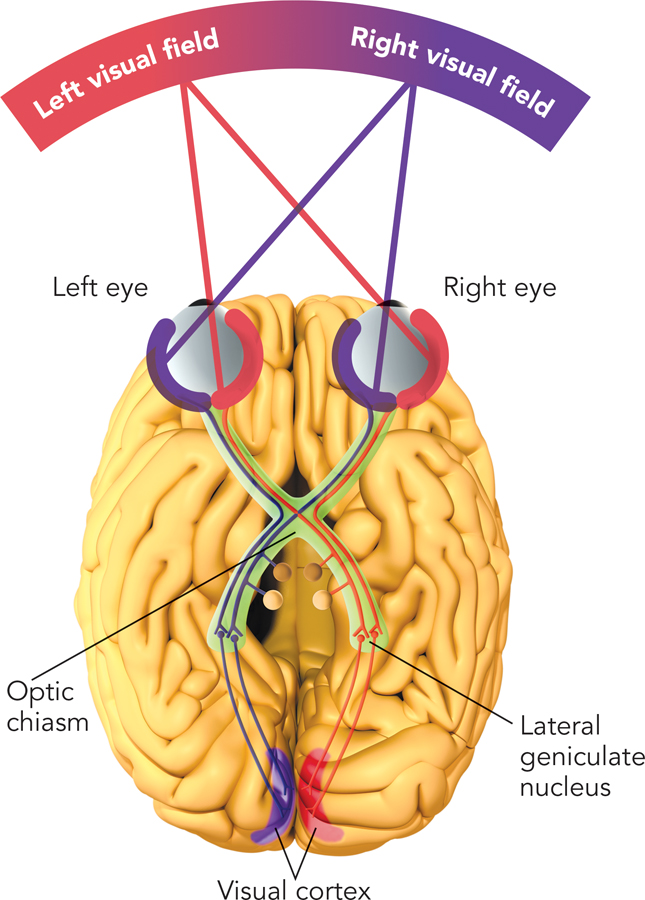 figure 5.30 The visual pathways in the brain Information makes its way from eye to brain in a series of steps. Signals switch sides, from one hemisphere of the brain to another, at the optic chiasm. Computations on the incoming signals are performed at the lateral geniculate nucleus. Signals are then sent to the visual cortex for additional visual information processing.
180
Cells in the lateral geniculate nucleus receive visual signals and perform “computations” on them. Some computations, for example, compare the amount of red-
wavelength light to green- wavelength light reaching the retina and thus produce the opponent process discussed earlier in the chapter (Shapley & Hawken, 2011).
The third step of processing, which we’ll consider in detail, occurs in the visual cortex.
THE VISUAL CORTEX. Signals from the lateral geniculate nucleus reach the visual cortex, a region in the rear of the brain devoted to processing visual information (Belliveau et al., 1991). The biological processing required for the perception of visual features discussed earlier (size, shape, motion, etc.) occurs in the visual cortex.
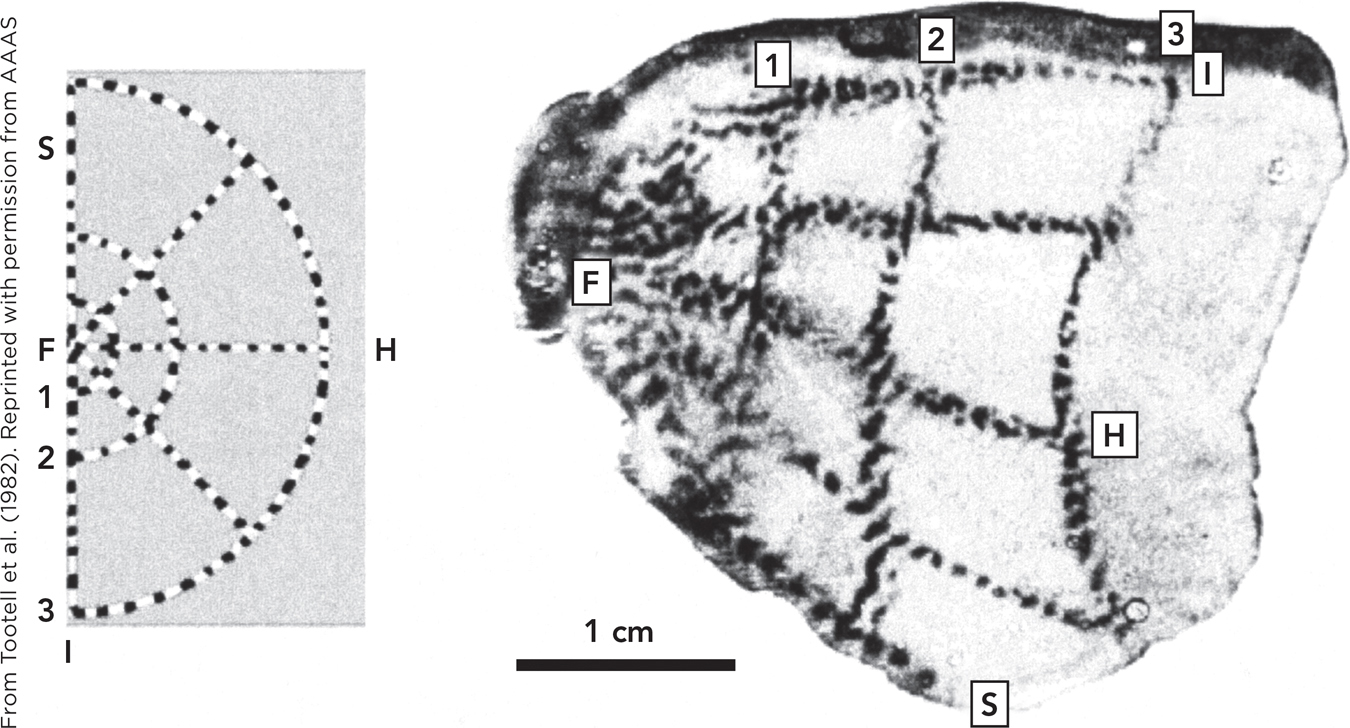
The visual cortex contains layers of cells that progressively integrate signals coming from multiple photoreceptors in the eyes. The first layer of processing maps retinal activation into visual cortex activation (Tootell et al., 1982). In this mapping, adjacent areas of the retina are represented in adjacent areas of the cortex (Figure 5.31).
These mappings from retina to visual cortex provide insight into visual illusions. Earlier in this chapter, you saw a size illusion: Sometimes two identical objects appear to differ in size (see Figure 5.1). It turns out that, during this visual illusion, cortical activation corresponds to their perceived size, not their actual size (Figure 5.32). Objects of the same actual size that appear larger/smaller have larger/smaller activation patterns in the cortex (Huk, 2008).
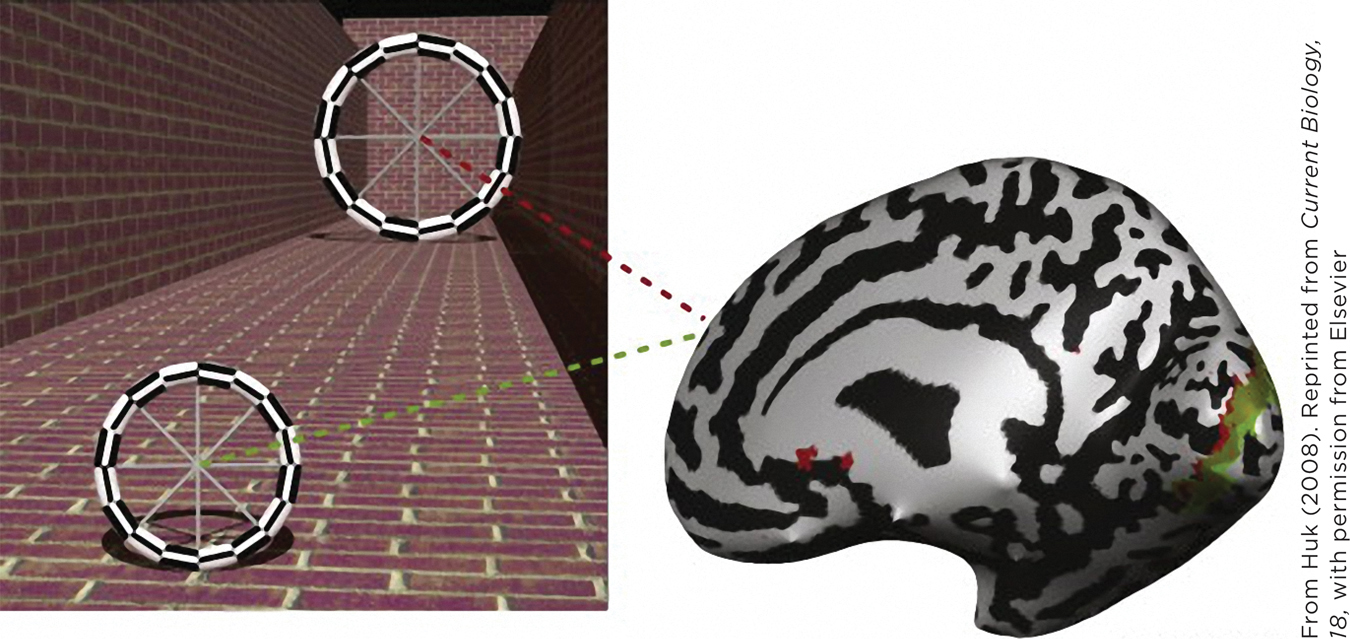
This result provides a link between levels of analysis (Figure 5.33). People experience illusions. The visual system’s processing of cues such as texture and converging vertical lines explains the illusions in terms of the workings of the mind. Research on the visual cortex shows what happens at the level of the brain.

181
182
More than a half-
More recent research on the visual cortex highlights the ways in which the cortex combines the processing of different types of information. Visual properties such as the shape, brightness, texture, and color of objects influence one another, due to complex information processing in the cortex that integrates information about these perceptual features (Shapley & Hawken, 2011). This integration produces more accurate perception of objects. If you view, for example, a blue car that’s partly in the shade, partly in the sun, and partly dented, the physical light that reaches your retina varies from one part of the car to another. Yet you do not perceive a multicolored car. You perceive, accurately, a car that is of a continuous shade of blue, as a result of your cortex’s ability to integrate multiple visual features.
Did this blue car example remind you of the earlier demonstration (Figure 5.17) of color constancy with an apple in a bowl of fruit? The same principle is at work.
WHAT DO YOU KNOW?…
Question 7
Match each structure on the left with its feature on the right.