GDP and Our Standard of Living
GDP data provides us with one way of comparing the productivity of different nations. But it doesn’t necessarily give us an accurate picture of the standard of living in each country. For example, China, India, and Brazil each have a GDP that places them among the top ten largest economies in the world. But clearly one would not describe the average citizen in these countries as wealthy. This section describes some of the factors that do not get measured in GDP and a few alternative measures of standard of living.
Population and GDP Per Capita
GDP per capita A country’s GDP divided by its population. GDP per capita provides a useful measure of a country’s relative standard of living.
How can GDP measures better reflect a country’s population? The most common approach is to divide GDP by a country’s population, resulting in a statistic known as GDP per capita. GDP per capita is a useful measure of the relative standard of living of citizens in different countries. However, by simply dividing GDP by population, GDP per capita does not take into account the differences in wealth between rich and poor within a country, and therefore might not fully reflect the standard of living of the typical citizen. For example, U.S. GDP per capita is about $50,000 per person, but certainly the typical American family of four does not earn $200,000 a year. Yet, GDP per capita data is fairly easy to measure, and thus is a useful measure of relative wealth between countries.
An alternative measure of the standard of living is median household income. Being the median household means that half of all households make less income and the other half make more. Using this statistic reduces the effect of outliers (that is, the very destitute or the superrich) skewing the averages. The U.S. median household income in 2013 was about $55,000, an amount that is closer to what middle-income households make.
Environmental Quality
People around the globe have become increasingly concerned with the impact economic activity has on the natural world. These days, it is difficult to watch a nightly newscast without seeing a report about some ecological disaster or looming environmental problem. Government, consumers, and businesses in the United States spend hundreds of billions of dollars annually to protect the environment at home and abroad. Surprisingly, however, our national income and production statistics do little to account for the environmental benefits or harmful impacts of economic activity.
In 1992, the Bureau of Economic Analysis decided to develop an experimental set of economic accounts known as the Integrated Environmental and Economic Satellite Accounts. Preliminary versions of these green GDP accounts were published in 1994, and later Congress directed the DOC to set up an outside panel of experts to study this issue in greater depth. The DOC asked the National Academy of Sciences to look at green economic accounting, which it did, appointing a select panel.
119
How Should Environmental Quality Be Incorporated into GDP Measures?
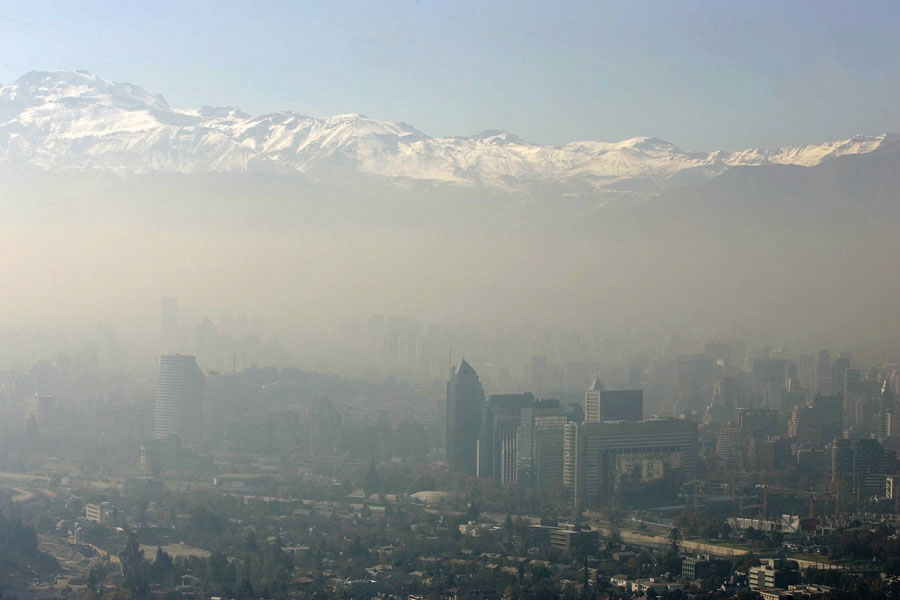
Would you rather live in a poor country with a pristine environment or a rich country with a filthy, polluted environment? If you’re wishing for a third choice somewhere in between, you likely share the opinion of the majority. Most of us enjoy the benefits that a clean environment provides, which contribute to our standard of living.
But creating a measure of GDP that incorporates the productive value of a clean environment is not easy. In fact, it can be downright arbitrary. How does an economy accurately measure the economic impact a clean environment provides? Economists can make a rough estimate of the costs of pollution from the increase in medical costs. But placing a value on the ability to take walks in the fresh air or view a landscape void of smog is much more difficult. How then does an economist measure the value of a clean environment?
One clue might be the extent to which countries spend resources to reach a target level of environmental quality. For example, many countries have environmental regulations that limit the amount of carbon emissions or provide tradable permits forcing companies to pay for the pollution they cause. But because countries have varying environmental goals, a measure of GDP that includes the external value of carbon offsets would not be comparable across countries.
What we do know is that wealthier countries tend to place greater value on the environment compared to developing countries, which might view environmental quality as a luxury compared to necessities such as food, health care, and education.
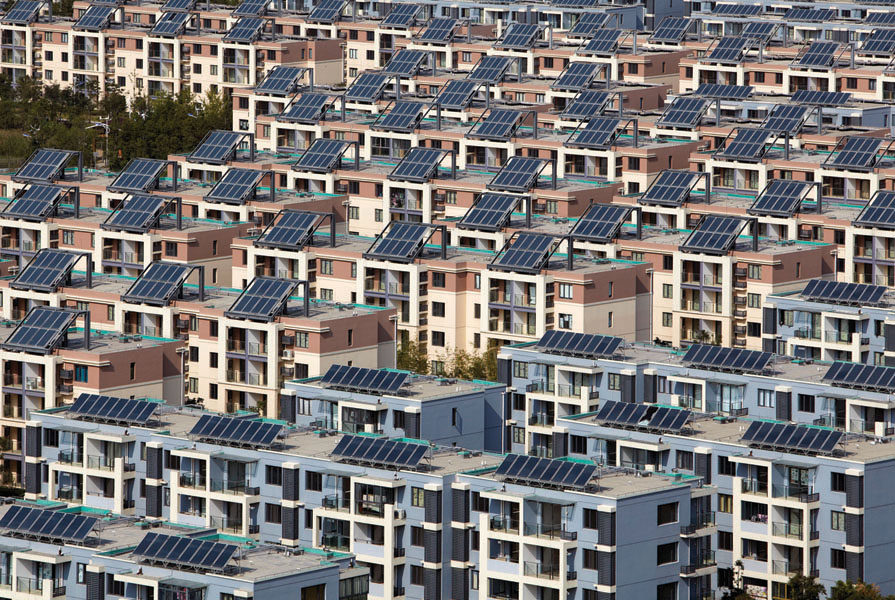
Countries often undergo environmental degradation when transitioning from agricultural to manufacturing-based industries. However, as countries develop, they tend to spend more resources to improve environmental quality. The growth of investment in green technologies and even “green cities” throughout the world is proof of the increasing value people are placing on the environment once the resources are available to do so.
But investments in green technologies are not fully reflected in the NIPA. Although GDP measurements include the costs of cleaning up pollution and the jobs created from the development of renewable energy sources and environmental friendly technologies, GDP does not measure the human value placed on environmental quality.
Efforts have begun to find a replacement for traditional GDP measures. The World Resource Institute states that a macroeconomic indicator that values natural resources must include (1) genuine economic welfare, not just economic activity, and (2) an indicator of the sustainability of that welfare over time. For example, clearing the rainforests generates economic activity as defined in traditional GDP measures; however, the deleterious effects of such activities on future generations must also be taken into account.
Some progress has been made. Calculations are being made to determine what is “sustainable.” Carbon footprints are being measured. And recent efforts have gained momentum in creating measures of economic progress that include environmental quality. One such measure is the Genuine Progress Indicator (GPI), which includes economic activity in GDP but also the costs of generating that activity, including resource depletion, crime, and pollution. For example, countries that experience strong economic growth but do so in an unsustainable manner would see a reduction in their GPI.
But difficulties remain in establishing an alternative measure to GDP. For example, GDP is “value neutral,” meaning that it measures what is produced, not what should be produced or how it should be produced. Because people place different values on the environment and have different ideas on what constitutes a society’s well-being, any alternative measure is not likely to be widely adopted until a consensus is achieved on what a benchmark level of environmental quality should entail.
The DOC panel concluded that “extending the U.S. NIPA to include assets and production activities associated with natural resources and the environment is an important goal.”4 In terms of natural resources, these include the flow of services that are produced by environmental capital such as forests, national parks, and ocean fisheries.
120
But from a consumer’s perspective, a cleaner environment also provides value. The ability to hike in parks, to suntan on clean beaches, and to swim in lakes and rivers all depend on a level of environmental quality that does not show up in our national accounts.
Nonmarket Activities and the Informal Economy
In addition to addressing such concerns as environmental impacts and the value of nonmarket natural resources, the DOC panel’s recommendations highlight some of the broader shortcomings of the NIPA. For example, the national accounts ignore nonmarket transactions, investments in human capital, and the use of people’s time.
Nonmarket transactions are an important part of our everyday lives. If a maid cleans your apartment, GDP rises, but if you did the same job yourself, GDP is unaffected. The same is true for babysitting, lawn care, and car maintenance. There is one exception—NIPA already imputes (estimates) the rental value, less expenses, of owner-occupied homes and adds this to GDP.
Many people believe that the NIPA should be an index of the well-being found within our economy. In that case, it would ideally need to take into account the implications of economic activity the DOC panel noted and more, perhaps including data on life expectancy; business spending on research and development; the stock of human capital, including education and health; greenhouse gas emissions; income distribution; poverty rates; and unemployment rates.
informal economy Includes all transactions that are conducted but are not licensed and/or generate income that is not reported to the government (for tax collection).
The informal economy (the underground or black market) is a large unmeasured component of our economy. The informal economy can be as simple as the money earned from a garage sale or from items sold on eBay that are not reported to the IRS. It also includes transactions dealing with illegal goods and services, such as drugs, prostitution, or unlicensed gambling. Finally, the informal economy includes the income earned by undocumented residents—those working on farms, factories, or restaurants for cash, or workers hired for housekeeping or babysitting services who are easily paid under the table. The size of the informal economy in the United States is estimated at around 10% of GDP. This is relatively small compared to many developing countries that can have an informal economy valued at as much as 50% of their GDP.
The effects of the informal economy can be positive and negative. On the upside, people working in the informal economy are generating and spending income, contributing to national economic activity. Countries with large informal markets have total output that is significantly larger than what is officially reported in their GDP statistics. On the downside, those working in the informal economy do not pay much if any taxes, placing a greater tax burden on the rest of society. Also, the informal economy is less regulated, which increases the probability of corruption and crime.

Despite these shortcomings in the NIPA measurements, it is important to keep the NIPA’s original purpose in mind. As the DOC panel noted,
121
The modern national income and product accounts are among the great inventions of the twentieth century. Among other things, they are used to judge economic performance over time, to compare the economies of different nations, to measure a nation’s saving and investment, and to track the business cycle. Much as satellites in space can show the weather across an entire continent, the national accounts can give an overall picture of the state of the economy.5
The NIPA has served us well. Still, making adjustments to account for various environmental and other nonmarket considerations might provide us with an even better picture of the health of our economy. But we must keep in mind that an aggregate measure of the economy cannot be all things to all people. As we add complexity to an already complex undertaking, the NIPA may lose some effectiveness as a measure of economic activity, as pointed out earlier in the discussion of environmental quality. This is a difficult balancing act facing policymakers.
The NIPA allow us to track business cycles, compare the domestic economy with that of other nations, and take a crude measure of our standard of living. In the next chapter, we will see how two other important policy variables, unemployment and inflation, are measured.
The next several chapters will focus on developing explanations of short-term movements in the business cycle and long-term economic growth (the trend line in Figure 2). If we can understand why upturns and downturns occur, we may be able to devise policies that reduce the severity of business cycle swings while promoting economic growth. These investigations and policy objectives form the essence of modern macroeconomic analysis.
GDP AND OUR STANDARD OF LIVING
- GDP per capita divides GDP by population, providing a useful measure of a country’s relative standard of living.
- GDP does not include most of the benefits and costs from environmental and natural resources.
- GDP does not include nonmarket activities or the informal economy.
- Despite the shortcomings of the GDP measure, GDP provides a simple and consistent way of measuring the overall economic activity in an economy.
QUESTIONS: Each summer, many of the campsites at America’s favorite national parks sell out months in advance due to their limited supply, low prices, and prime locations and views. This has led entrepreneurial individuals to reserve these campsites well in advance and then sell the reservations for a high premium on sites such as Craigslist. Does the money earned by these campsite scalpers appear in GDP? Why or why not? Suppose the government cracks down on campsite scalping by doubling the price of campsites. Would this affect GDP? Explain.
The money earned by the scalpers is not counted in GDP because scalpers are not likely to report this income on their tax returns, and thus this is considered part of the informal economy. The revenues earned by Craigslist, a legitimate enterprise, for the transaction would count toward GDP.
If the government doubles the price of campsites and they continue to sell out, then GDP would increase because money paid to the National Parks is part of consumption spending in GDP.
122