Aggregate Demand
aggregate demand The output of goods and services (real GDP) demanded at different price levels.
The aggregate demand (AD) curve (or schedule) shows the output of goods and services (real GDP) demanded at different price levels. The aggregate demand curve in Figure 1 looks like the product demand curves we studied earlier. They both slope downward, showing how output rises as prices fall, and vice versa. However, it’s important to remember that these two curves and the reasons they slope downward are different.

Why Is the Aggregate Demand Curve Negatively Sloped?
In Chapter 3, we studied why product demand curves slope downward due to income and substitution effects. To review, an income effect occurs when the price of a given product falls, causing consumers’ spendable income to rise, allowing them to afford more of all goods. A substitution effect occurs when the price of a product falls, causing consumers to purchase more of the product because they substitute it for other higher priced goods. Income and substitution effects work the other way when the price of a given product rises. Although these explanations work for a product demand curve, they do not explain why an aggregate demand curve slopes downward, because aggregate demand does not measure the demand for just one product, but rather it measures the demand for all products. For the latter, we need to look at other factors influencing the aggregate economy.
wealth effect Households usually hold some of their wealth in financial assets such as savings accounts, bonds, and cash, and a rising aggregate price level means that the purchasing power of this monetary wealth declines, reducing output demanded.
The Wealth Effect One reason that real output declines when the aggregate price level rises is the resulting reduction in household wealth, called the wealth effect. Households usually hold some of their wealth in financial assets such as savings accounts, bonds, and cash. A rising aggregate price level means that the purchasing power of this monetary wealth is declining. If, for example, you have $5,000 in a savings account and prices rise throughout the economy, that $5,000 will now purchase less than before. This reduction in household purchasing power means that some purchases are put on hold, thereby reducing output demanded. This is represented by a movement from point a to point b in Figure 1.
213
Impact on Exports When the U.S. aggregate price level rises, American goods become more expensive in the global marketplace. Higher prices mean that our goods are less competitive with the goods made in other countries. The result is that foreigners purchase fewer American products, and our exports decline. A decrease in exports means that the demand for domestically produced goods and services (the quantity purchased by foreign consumers, a component of real GDP) also declines. Therefore, higher prices result in lower real output.
Interest Rate Effects Interest rates are the prices paid for the use of money. If we assume for a moment that the quantity of money is fixed, then as aggregate prices rise, people will need more money to carry out their economic transactions. As people demand more money, the cost of borrowing money—interest rates—will go up. Rising interest rates mean reduced business investment, which results in a drop in quantity demanded for real GDP, shown in Figure 1 as a movement from point a to b and falling real output.
In summary, the aggregate demand curve is negatively sloped because of three factors. When the aggregate price level rises, this lowers household purchasing power because of the wealth effect. A rising aggregate price level also lowers the amount of exports because our goods are now more expensive. Furthermore, a rising aggregate price level increases the demand for money and therefore drives up interest rates. Rising interest rates reduce business investment and reduce the quantity demanded of real GDP. In each case, as aggregate prices rise from P0 to P1, quantity demanded of real GDP falls from Q0 to Q1.
Determinants of Aggregate Demand
We have seen that the aggregate demand curve is negatively sloped. Everything else held constant, a change in the aggregate price level will change the quantity of real GDP demanded along the aggregate demand curve. The determinants of aggregate demand are those factors that shift the entire aggregate demand curve when they change. They are the “everything else held constant.” These include the components of GDP: consumption, investment, government spending, and net exports.
If one of these components of aggregate spending changes, the aggregate demand curve will shift, as shown in Figure 2. At first, aggregate demand is AD0, therefore a shift to AD1 represents an increase in aggregate demand; more real output is demanded at the same price level, P0. If, for example, businesses decide to invest more in new technology, more real output is now demanded at the current price level, P0, and at all other price levels. For similar reasons, a decrease in aggregate demand to AD2 means that less real output is being demanded. If consumers fear the onset of a recession and decide to reduce spending to increase their savings, then less output will be demanded at all price levels.

214
Let’s look at these determinants of aggregate demand more closely. What might cause the various components of aggregate expenditures to change, shifting the AD curve?
Consumer Spending Consumer spending is the largest component of aggregate demand, representing about 70% of total spending in an economy. The level of spending as a percentage of overall output is relatively stable over time. Still, consumer spending is affected by four major factors: wealth, consumer confidence, household debt, and taxes. Because consumer spending represents such a large part of the economy, even small changes in these factors can have a significant impact on the economy. And in times when consumption changes a lot, the effect on the economy can be dramatic.
For example, when the technology-heavy NASDAQ Stock Market surged in the late 1990s, Federal Reserve Chairman Alan Greenspan became concerned that a consequent surge in consumer spending from the newly added wealth would increase aggregate demand to AD1 in Figure 2, resulting in higher inflation. (We’ll see why spending can lead to inflation a little later in this chapter.) When the NASDAQ collapsed in the early 2000s, the Federal Reserve then became worried that sinking consumer confidence (caused by falling wealth) would reduce consumption spending, thereby making the recession worse. In late 2008 and early 2009, falling housing prices and a stock market slump, coupled with reduced consumer confidence, caused an unusually large drop in consumer spending that was an important factor in the depth of the recession.
Note that changes in wealth have two similar but distinct impacts on aggregate demand. First, as described earlier, when aggregate prices rise, the purchasing power of financial assets falls, reducing the amount of goods and services that can now be purchased with this money. This is a movement along an existing aggregate demand curve to a higher price level (point a to b in Figure 2).
Second, described here, is a decrease in wealth (for example, caused by a stock market crash) that reduces consumption at all price levels. In this case, the entire aggregate demand curve shifts from AD0 to AD2 in Figure 2. This is the impact of changing wealth on consumer spending that is usually the focus of attention by the media and policymakers.
Consumer expectations and confidence about the economy play a significant role in determining the level of consumer spending. High confidence in the economy eases job security fears and stimulates consumer spending, shifting the aggregate demand curve to the right. High family debt ratios restrict access to future credit, reducing spending on high-ticket items often bought on credit. Increasing taxes reduces disposable income, reducing consumption, shifting the aggregate demand curve to the left.
Investments Investment (spending, mostly by businesses for structures, equipment, and software) is determined mainly by interest rates and the expected rate of return on capital projects. When interest rates rise, investment will fall and the aggregate demand curve will shift to the left, and vice versa.
When business expectations become more favorable—perhaps some new technology is introduced, or excess capacity is reduced—investment will increase, and the aggregate demand curve will increase, or shift to the right. But if businesses see clouds on the horizon, such as new regulations, higher taxes, restrictions on the use of technology, or excess capacity, investment will drop, and the aggregate demand curve will shift to the left.
Because investment decisions tend to be larger in magnitude than everyday consumption purchases, investment varies much more from year to year. Therefore, although investment represents a smaller percentage of aggregate demand, its relative instability can result in a significant effect on the aggregate economy.
215

Government Spending and Net Exports Government spending and net exports have essentially the same effect on the aggregate economy as consumer and investment spending. When government spending or net exports rise, aggregate demand increases, and vice versa.
When the national income of a foreign country rises, some of this money is used to buy more American goods and services. The increase in demand for U.S. goods and services in other countries results in more exports, which increases U.S. aggregate demand. A change in foreign exchange rates will also affect aggregate demand. An appreciation, or rise, in the value of the euro, for instance, will result in Europeans buying more American goods because a euro will buy more. Again, this change increases U.S. exports and U.S. aggregate demand. These effects on aggregate demand are offset by increases in imports of foreign goods, because goods are being demanded from outside of the United States.
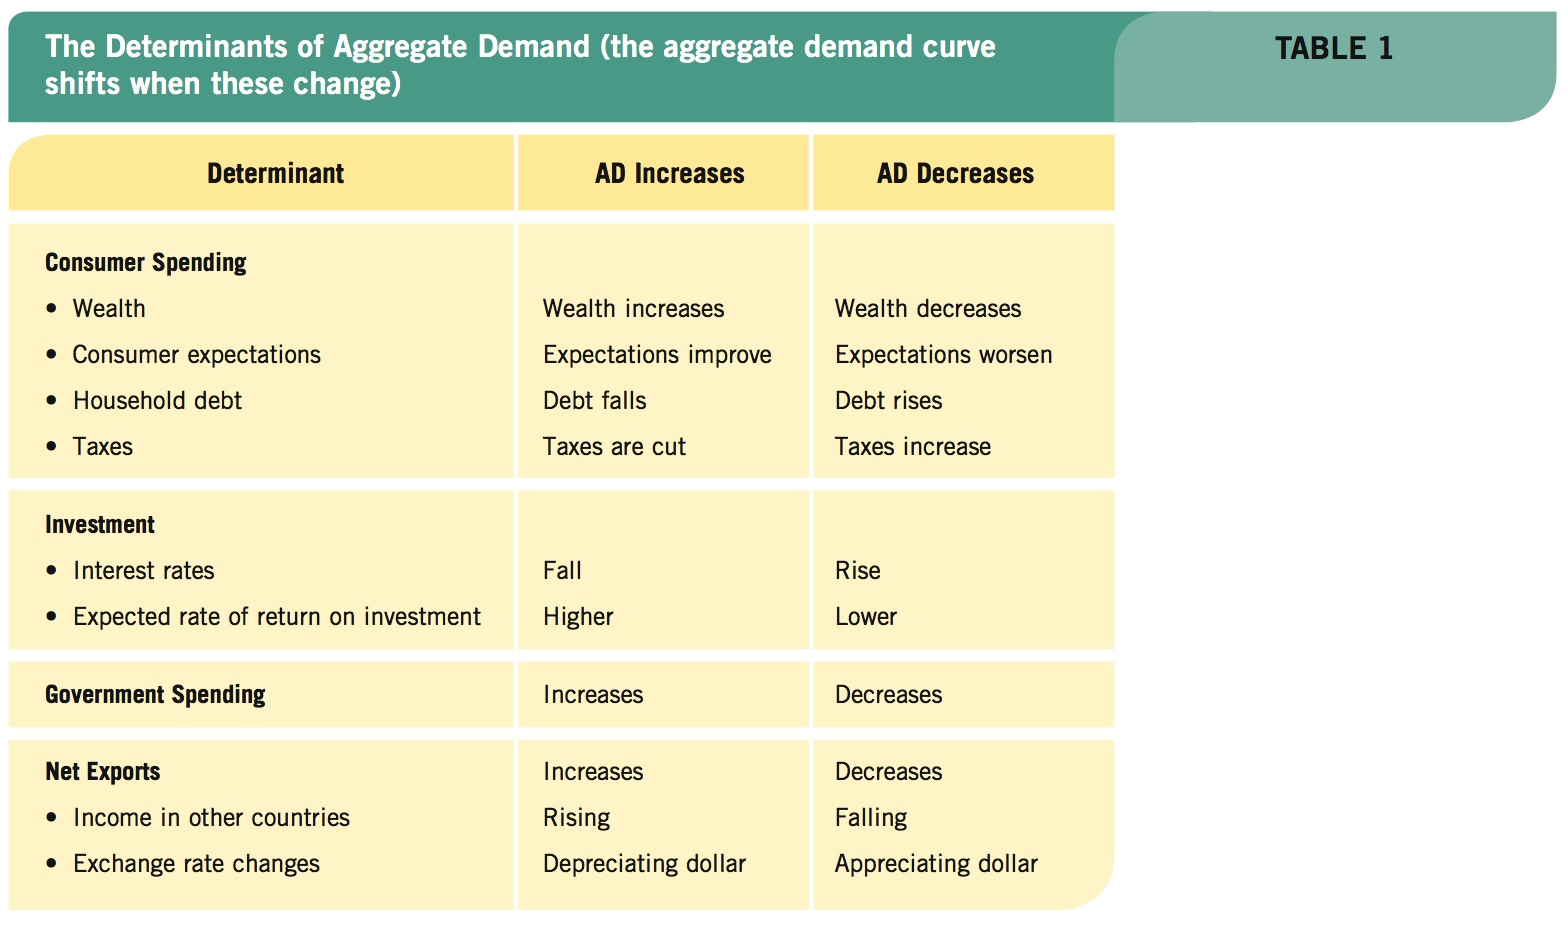
A quick summary is now in order. The aggregate demand curve shows the quantities of real GDP demanded at different price levels. (The derivation of the AD curve using the Keynesian fixed price model is shown in the Appendix to this chapter.) The aggregate demand curve slopes downward because of the wealth effect (the value of monetary assets falls when the price level rises), because exports fall as domestic prices rise, and because rising prices raise interest rates, which reduce investment. On the other hand, changes in one of the determinants of aggregate demand shift the aggregate demand curve. Table 1 summarizes the determinants of aggregate demand.
Again, the determinants of aggregate demand are those “other factors held constant”: consumption, investment, government spending, and net exports. If one of those determinants changes, the entire aggregate demand curve will shift. Keep in mind that changes in the determinants are most important for policymaking. When a policy is enacted (say, lower tax rates), policymakers expect to stimulate consumer and investment spending, increasing aggregate demand, output, and employment.
216
Did the Collapse of the Housing Market Affect Aggregate Demand?
From 2006 to 2011, the U.S. housing market took a tremendous dive, with home values falling an average of 32% over this period. Some of the hardest hit cities, such as Phoenix, Las Vegas, and Miami, saw average home values drop by up to 60%.
We know how the housing market affected the economy by creating a near collapse of the financial system and the stock markets, along with causing a severe recession and high unemployment. But the drop in housing values also had an important direct impact on aggregate demand as homeowners altered their consumption patterns.

While much attention has been focused on households that borrowed to finance their houses or had used their homes to borrow additional money during the housing boom, in 2013 about 30% of homes in the United States did not have mortgages. These are homes that had mortgages that had already been paid off, or were originally paid for in cash. Many of these homes without mortgages are owned by older individuals who spent much of their lives paying off their 15-year or 30-year mortgages.
When households own their homes outright, the value of these homes often represents a large proportion of their assets. For these homeowners, a drastic drop in the value of their homes creates a great deal of uncertainty. For example, it becomes more difficult to rely on the value of their homes to provide a comfortable retirement. Some, for example, sell their homes for something smaller and cheaper (especially once the kids move out), using the excess money for daily expenses. When the price of homes fell, those who planned to sell their homes found that they could not get enough money to live comfortably. Some even chose to return to work.
As a result, the drop in housing values created a large wealth effect among homeowners. Homeowners felt poorer, and as a result, changed their consumption habits accordingly. Instead of relying on home values for future income, homeowners saved more to ensure a comfortable future. By increasing savings, there was a corresponding drop in consumption, decreasing aggregate demand. Indeed, the collapse of the housing market did more than just affect financial markets and labor markets—it had a direct impact on aggregate demand.
As important as aggregate demand is in determining an economy’s output, aggregate demand tells only one part of the story. The other part, aggregate supply, describes the impetus for businesses to create and produce goods and services, which we turn to next.
AGGREGATE DEMAND
- The aggregate demand curve shows the relationship between real GDP and the price level.
- The aggregate demand curve has a negative slope because of the impact of the price level on financial wealth, exports, and interest rates.
- The determinants of aggregate demand are consumer spending, investment spending, government expenditures, and net exports. Changes in any of these determinants will shift the aggregate demand curve.
QUESTION: Consumer spending is related to disposable personal income (income minus taxes). In 2011 and 2012, the federal government reduced the payroll taxes paid by American workers from 6.2% to 4.2%. Describe how this change in taxes would affect consumption and aggregate demand.
A reduction in the payroll tax from 6.2% to 4.2% would increase disposable income and consumption, shifting aggregate demand to the right. However, because government spending is an element of aggregate demand, the loss in government revenue from the tax reduction may offset some of the increase in aggregate demand if government is forced to cut back on its spending.
217