FIGURE 4 UNEMPLOYMENT RATE VERSUS THE NATURAL RATE OF UNEMPLOYMENT
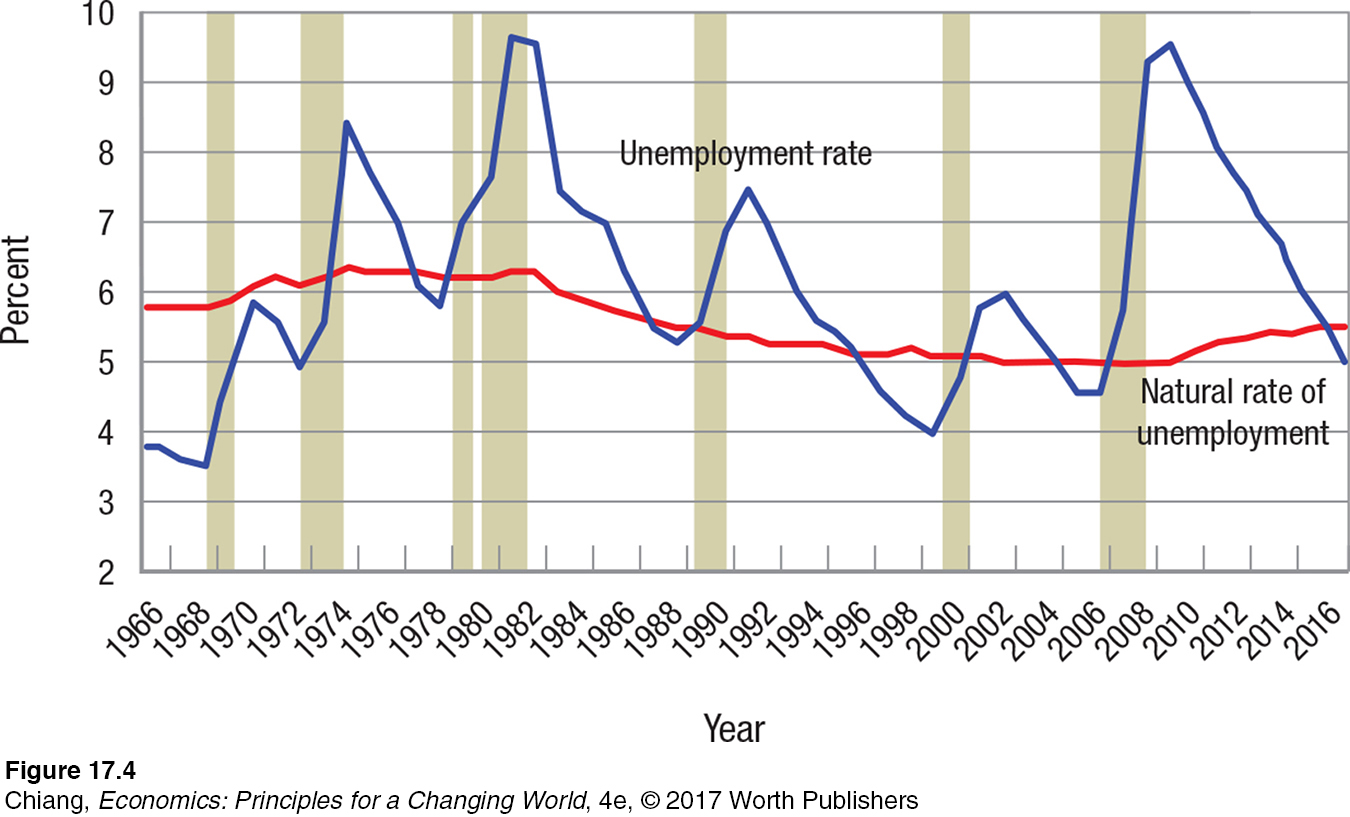 The average unemployment rate and the natural rate of unemployment are shown from 1966 to 2016. Periods of recession are shaded. The rising unemployment line and flatter downward slopes following the last three recessions indicate a longer recovery period for jobs caused by a jobless recovery.