FIGURE 1 CONSUMPTION AND DISPOSABLE INCOME
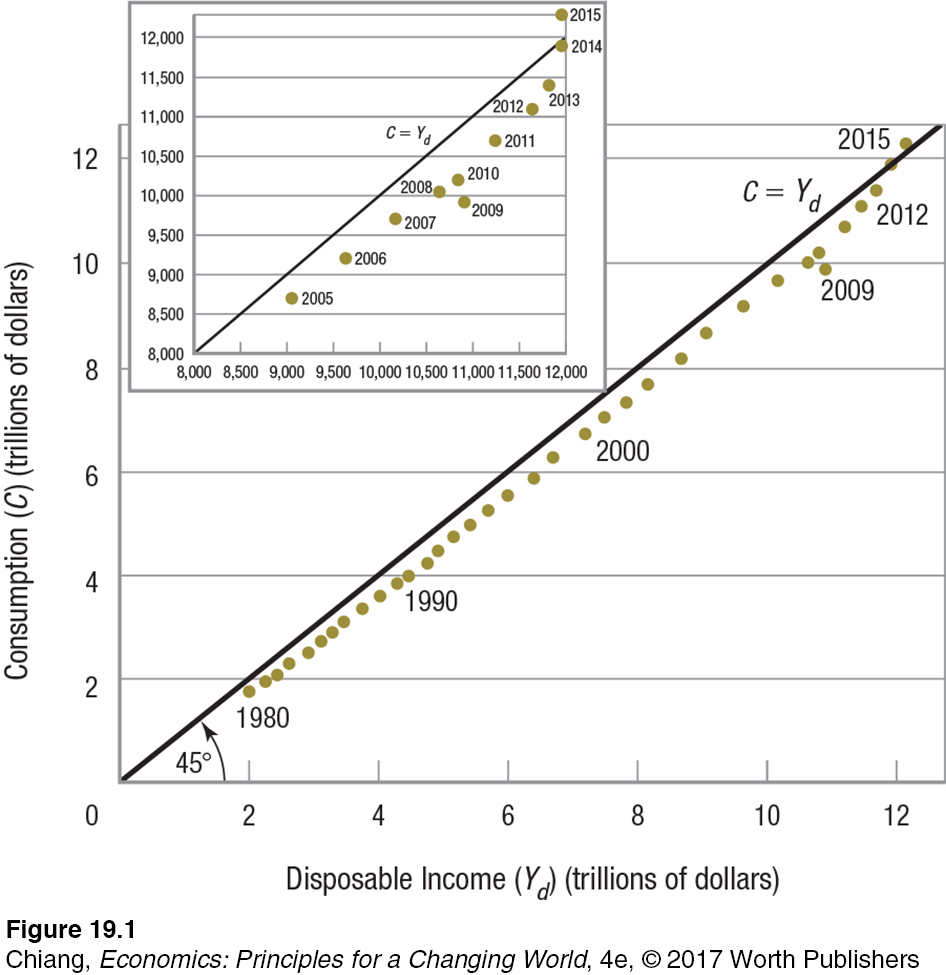 This graph shows personal consumption spending (C ) for the years since 1980. The 45° line represents an economy that spends its entire income each year, resulting in no saving. Annual saving (S) is equal to the vertical difference between the 45° line and annual consumption (S = Yd − C). The inset shows more clearly that consumption fell in 2009 when the economy was at the trough of the business cycle, but has since recovered.