FIGURE 4 THE PHILLIPS CURVE FROM 1961–1981: INSTABILITY AND SUPPLY SHOCKS
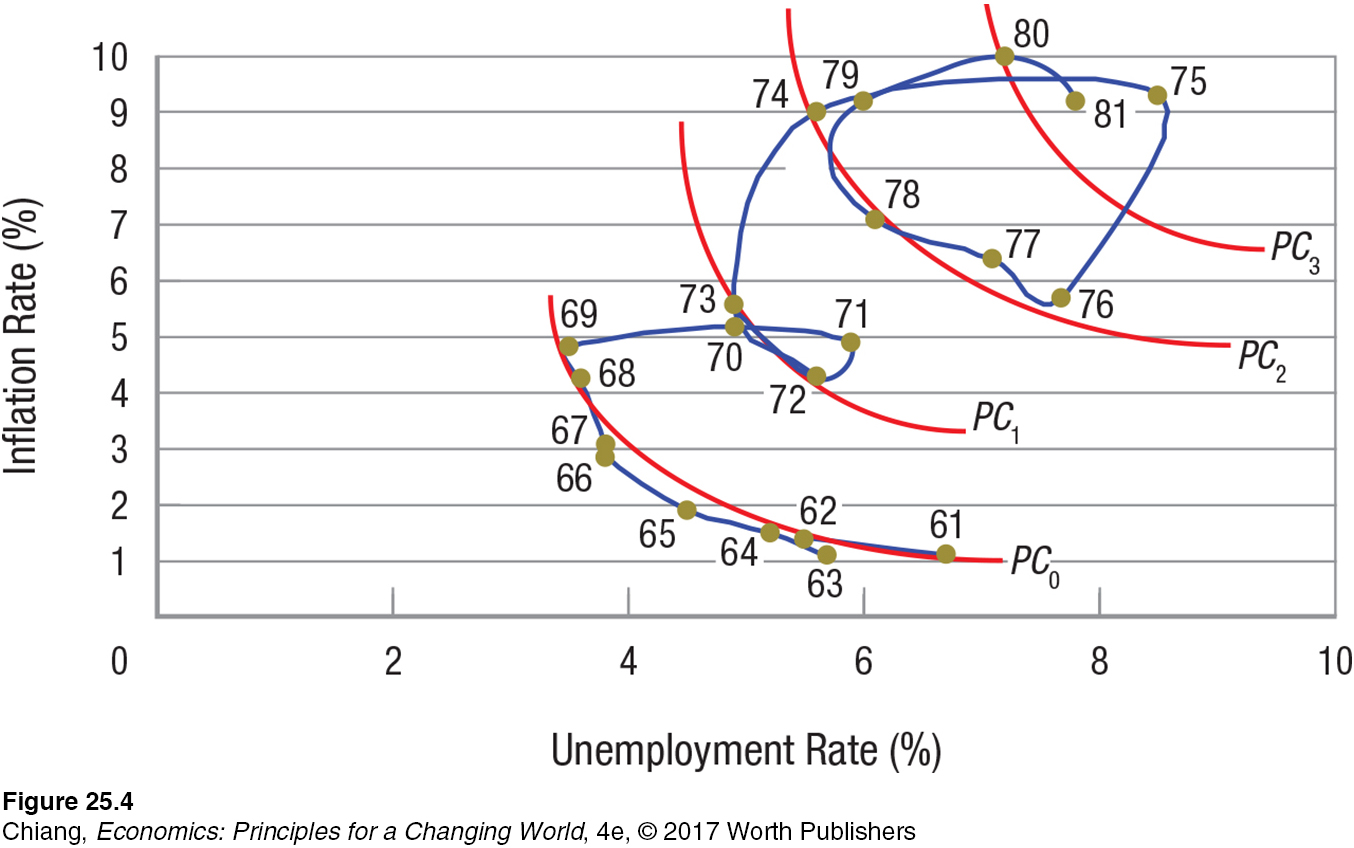 Just as policymakers were getting accustomed to accepting moderate inflation in exchange for lower unemployment rates, the economy surprised them. The entire Phillips curve began shifting outward during the early 1970s. Unemployment rates that, in the 1960s, had been associated with modest inflation of 2% to 3% quickly began requiring twice that rate. The inflation-unemployment tradeoff worsened throughout the 1970s and into the early 1980s, largely due to oil price shocks and rising inflationary expectations. Inflation and unemployment continued to rise, creating stagflation. By 1980 annual inflation was over 10%, and unemployment was over 7%.