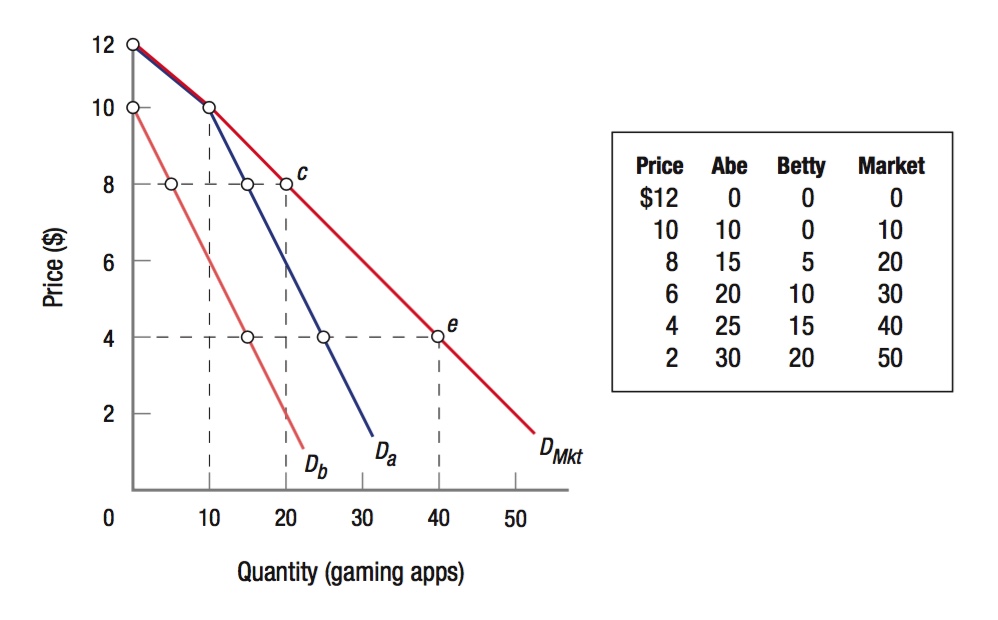
FIGURE 2 MARKET DEMAND: HORIZONTAL SUMMATION OF INDIVIDUAL DEMAND CURVES
 Abe and Betty’s demand schedules (the table) and their individual demand curves (the graph) for gaming apps are shown. Abe will purchase 15 gaming apps when the price is $8, buy 25 apps when the price falls to $4, and buy more as prices continue to fall. Betty will purchase 5 gaming apps when the price is $8 and buy 15 when the price falls to $4. The individual demand curves for Abe and Betty are shown as Da and Db, respectively, and are horizontally summed to get market demand, DMkt. Horizontal summation involves adding together the quantities demanded by each individual at each possible price.
