chapter summary
418
chapter summary
Section 1 The Distribution of Income and Wealth
15.1 Income: A flow of funds by individuals or households over time
Wealth: A stock of assets less liabilities at a given point in time

15.2 Types of Income Distribution
Functional distribution of income: The distribution of income according to inputs (factors) of production. Wages constitute nearly 70% of income using this approach.
Personal or family distribution of income: The percentage of income flowing to specific segments of the population. Quintiles (20% of the population) are used by the U.S. Census Bureau to measure income distribution.
Income inequality is measured either by constructing a Lorenz curve or by calculating a Gini coefficient for a specific population.
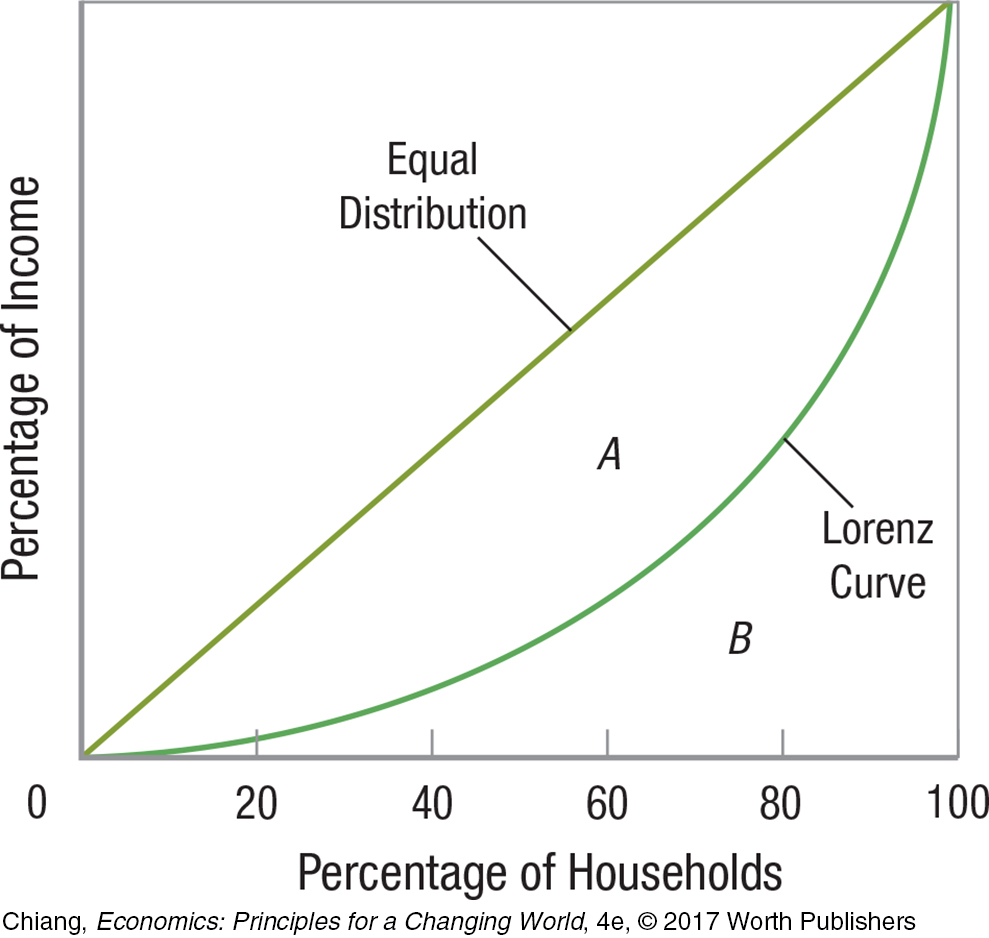
15.3 A Lorenz curve shows the cumulative income earned by each segment of the population. The farther the curve is from the 45 degree line, the more unequal the distribution of income.
A Gini coefficient is calculated as the ratio between A (area of income inequity) and A + B (total area below equal distribution line). The larger the Gini coefficient, the more unequal the distribution of income.
15.4 Redistribution policies are designed to reduce income inequality. Three common policies are:
Progressive taxation: Higher tax rates as income increases
In-
kind transfers: Unemployment benefits, welfare, Pell Grants (for college) Noncash benefits: Subsidized or public housing, Medicaid, food stamps
15.5 Since the 1970s, income distribution in the United States has become more unequal. Causes include:
Differences in education (human capital)
Economic discrimination
Increase in the number of two-
earner households
419
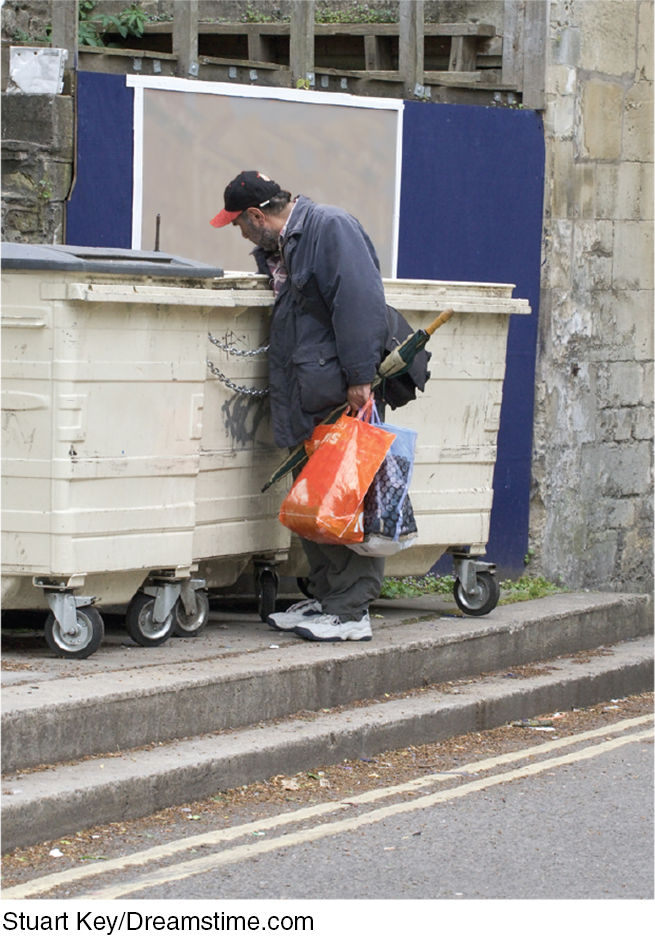
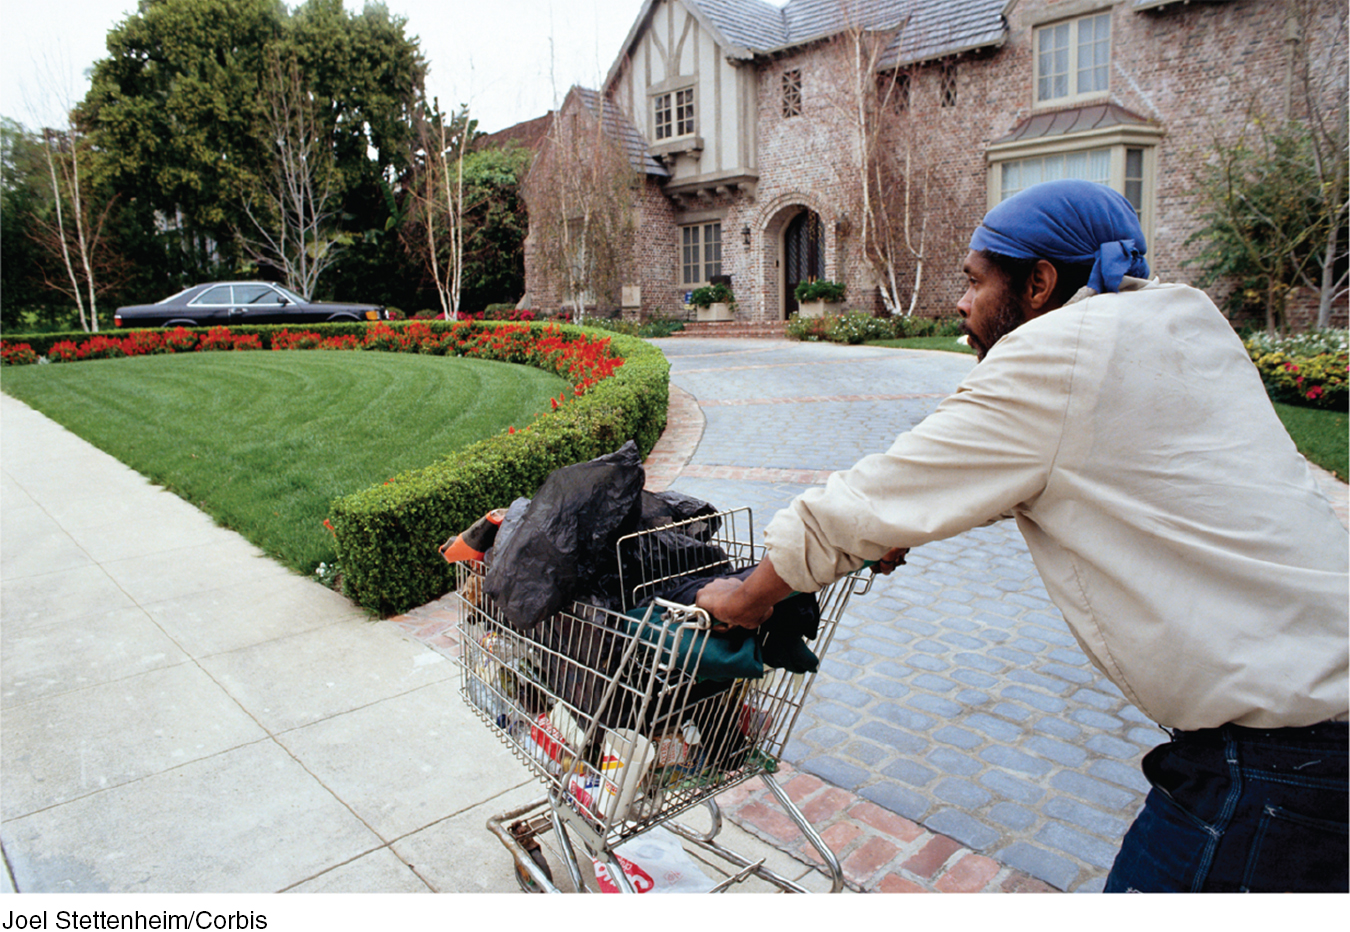
Section 2 Poverty
15.6 Poverty is defined differently by each country and by various international organizations.
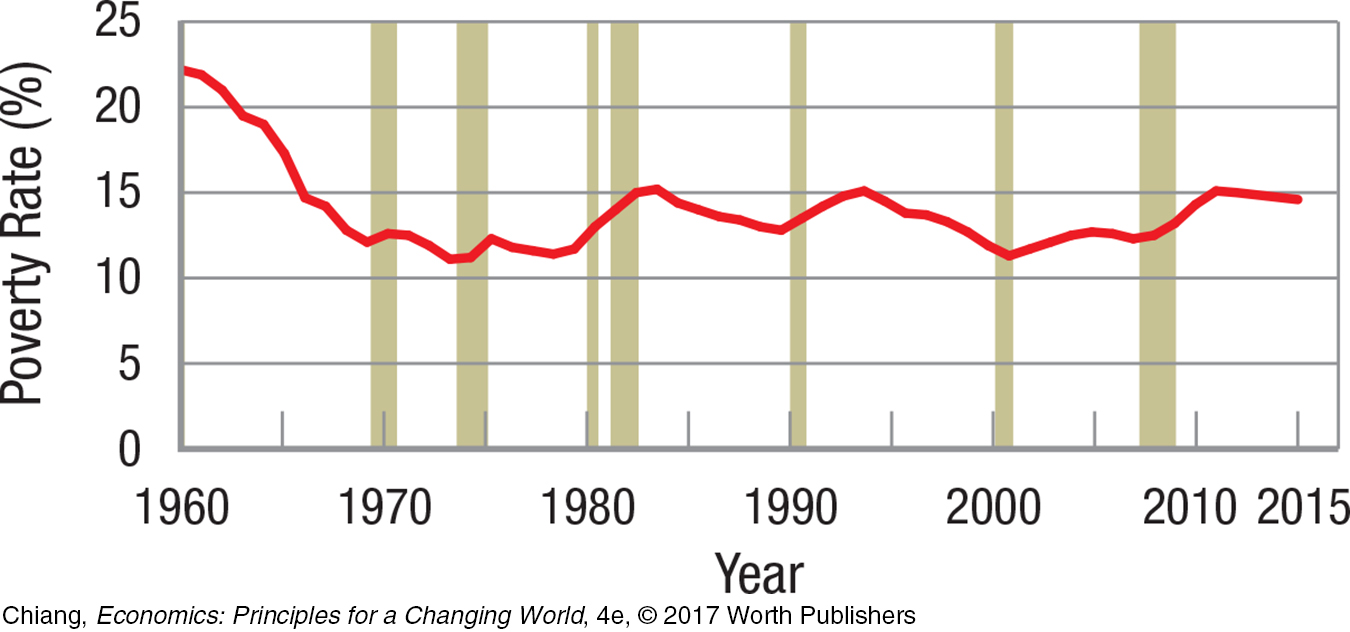
The poverty rate according to the U.S. Census Bureau is the percentage of the population with income below the poverty threshold. The poverty threshold includes all money income (before taxes are deducted) and cash benefits but excludes capital gains and noncash benefits.
15.7 The depth (or severity) of poverty can be measured in two ways
Income deficit: The dollar difference between the poverty threshold and a family’s income.
Ratio of income to poverty: The ratio of family income to the poverty threshold.
0.00–
0.51–
1.01–
15.8 Alternative Methods of Measuring Poverty
Includes after-
tax money income Includes noncash benefits (such as food stamps and housing subsidies)
Deducts work-
related expenditures (such as transportation and child care) and out- of- pocket medical expenditures
15.9 Two Solutions to Reduce Poverty
Reduce income inequality by expanding welfare and redistribution programs and making taxes more progressive.
Increase incentives to promote economic growth, which benefits all people, including the poor.
| Rawls: Rawlsian theory states that a society’s well- |
Versus | Nozick: This theory is based on the argument that property rights (including income) must be protected to provide incentives for growth, which will reduce poverty. |
420