MACROECONOMIC ISSUES THAT CONFRONT OUR FUTURE
Macroeconomic theory developed over the last 200 years, especially during the 80 years after Keynes. Until recently, economists thought they had the understanding and the tools to make depressions or deep recessions a thing of the past. For the last 30 years, a general consensus grew among economists that monetary policy should handle most of the task of keeping the economy on a steady low-
This section uses the theories and tools we have learned to understand the important issues that confront our economy today and in the future. Specifically, what are the pressing macroeconomic issues that will have the greatest effect on the next generation? What do macroeconomic theories tell us that policymakers can do?
If you take one idea away from this course, it should be that there is not one economic model or one economic policy that fits all occasions or circumstances. It often seems that one set of policymakers see “cutting taxes” as the universal cure-
In this section, we set out the key points surrounding three important issues facing our economy today and likely in the future: (1) the existence of jobless recoveries and persistent unemployment, (2) growing debt and the threat of long-
Are Recoveries Becoming “Jobless Recoveries”?
683
Globalization, new technologies, and improved business methods are making the jobs of policymakers much more difficult and may even be changing the nature of the business cycle. The 1990–
Taming the business cycle has proven to be just as much of an art as a science. Whenever economists believe they have finally gotten a handle on controlling the economy, some new event or transformation of the economy has taken place, humbling the profession. There is no doubt that between 1983 and 2007, the federal government and the Fed did a remarkable job of keeping the economy on a steady upward growth path, with only two minor recessions. The 1990–
jobless recovery A phenomenon that takes place after a recession, when output begins to rise, but employment growth does not.
When output begins to grow after a trough in the business cycle, employment usually starts to grow. But when output begins to rise yet employment growth does not resume, the recovery is called a jobless recovery.
We have already seen that business cycles vary dramatically in their depth and duration. The Great Depression was the worst downturn in American history, while the 2001 recession was one of the mildest. During that recession, the unemployment rate never rose above 6% and real output (GDP) fell only one-
Figure 7 shows how the 2007–
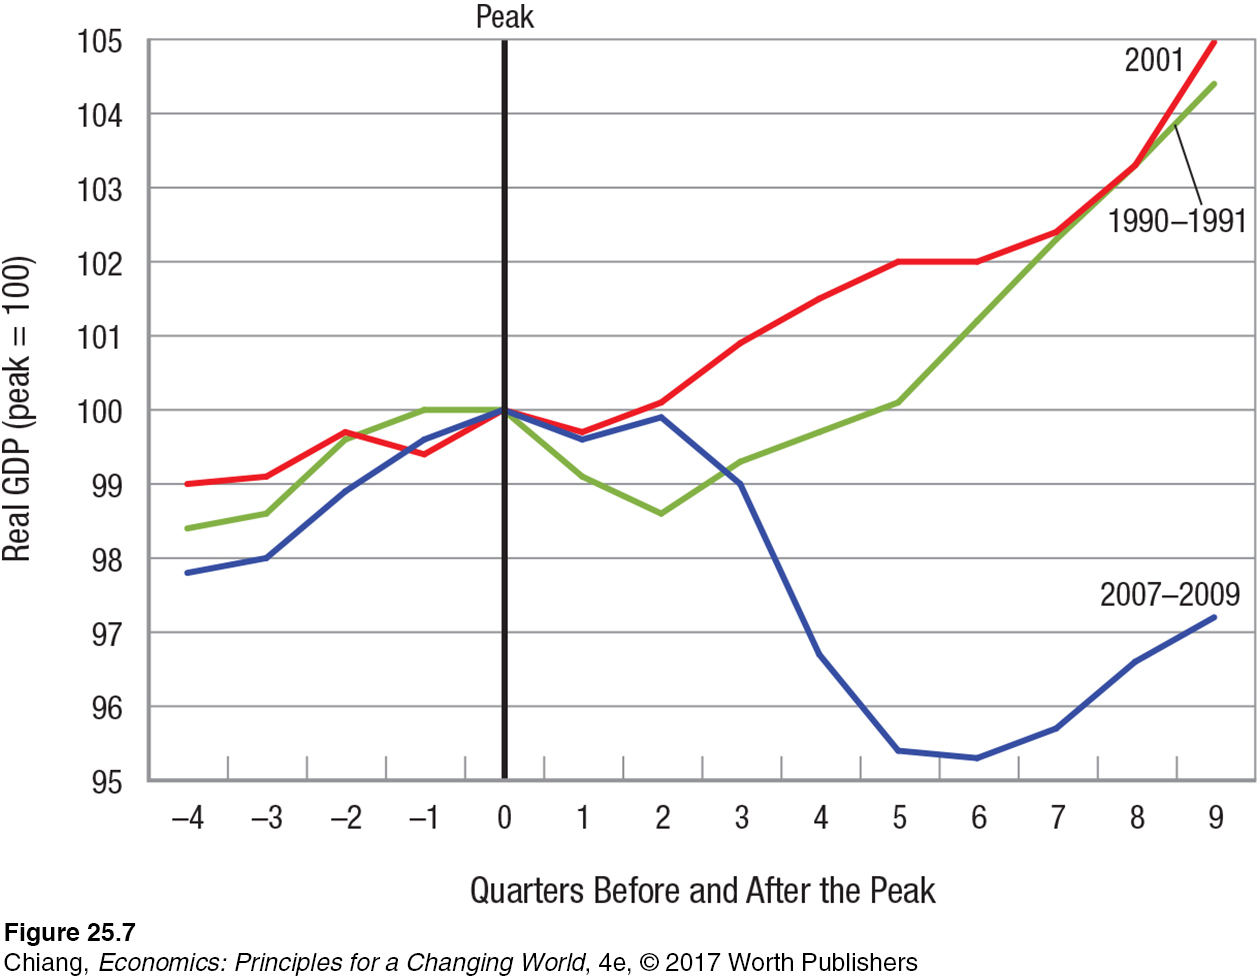
Notice in this figure that both the 1990–
684
In contrast, the 2007–
Figure 8 presents the same type of indexed graph for employment, though indexing the values monthly. Notice that for the 1990–
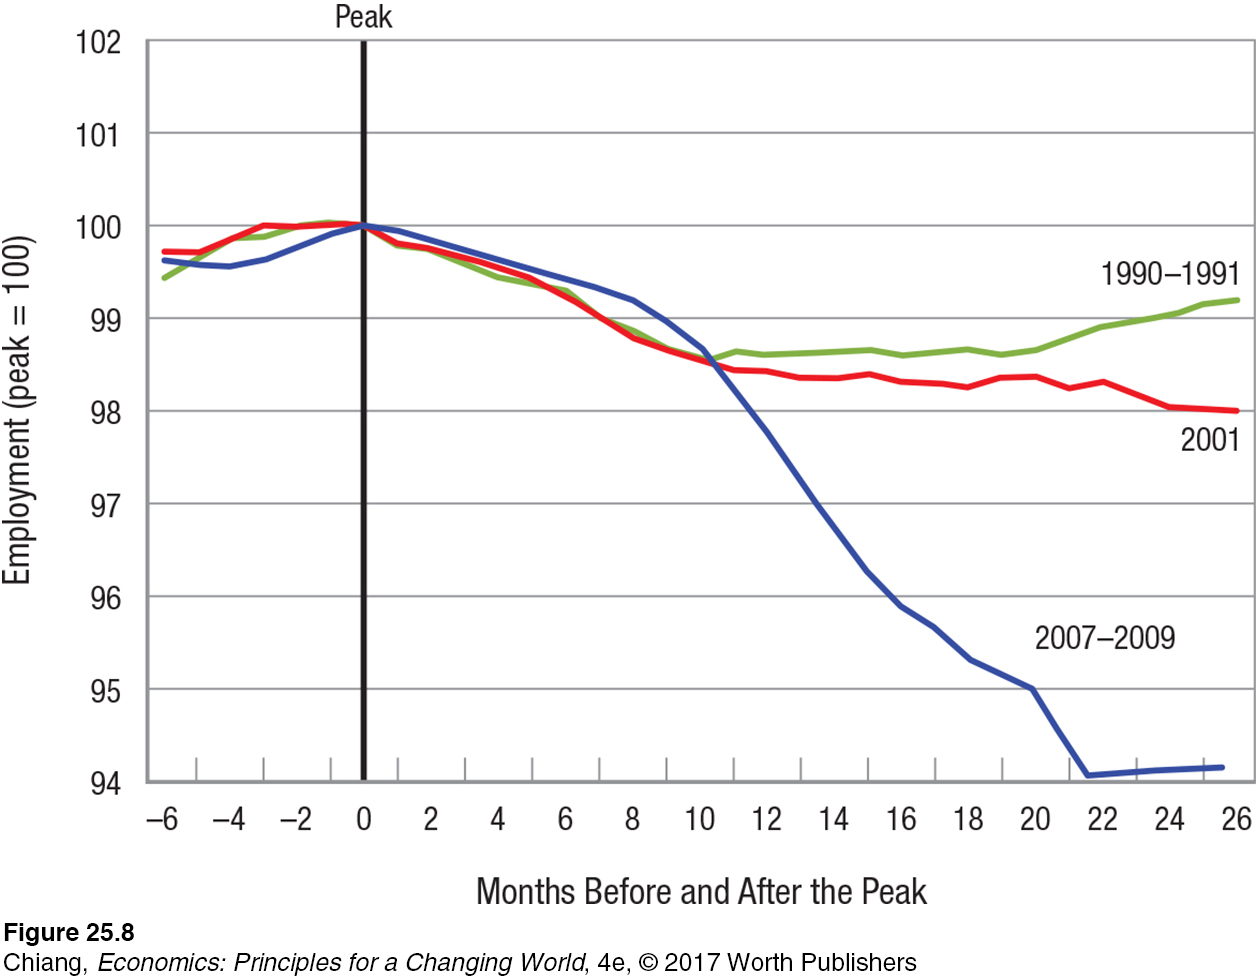

Several factors seem to drive jobless recoveries: rapid increases in productivity, a change in employment patterns, and offshoring. Productivity increases arising from improved telecommunications and online technologies make labor far more flexible than ever before. Now when the economy contracts, employers can more easily lay off workers and shift their responsibilities to the workers who remain. As a result, output may keep growing, or at least not drop much, even though fewer workers are employed. When the market rebounds, increased productivity permits firms to adjust to their rising orders without immediately hiring more people. This gives the firm more time to evaluate the recovery to ensure that hiring permanent employees is appropriate. This is why unemployment often keeps increasing even though the economy is recovering.
In addition, hiring practices have changed over the past few decades. Firms have begun substituting just-
Because the past three recoveries have been slow to add jobs, economists and policymakers are concerned that jobless recoveries have become the norm following recessions. The consequence of jobless recoveries is that reducing unemployment requires much more government action than before, especially expansionary fiscal and monetary policies. What type of fiscal and monetary policies can be used to address jobless recoveries?
685

Expansionary fiscal policy is most effective when government spending or tax cuts generate economic activity through the spending multiplier, which translates into jobs being created. Alternatively, fiscal policy can be used to provide incentives for employers to hire workers (such as tax incentives for hiring veterans) or employee incentives (such as increased tax deductions for low-
Alternatively, expansionary monetary policy can be used to promote employment. For example, increasing the money supply and lowering interest rates reduce the cost of financing major projects, creating jobs. The Fed’s recent quantitative easing programs that bought up risky mortgage-
Although plenty of policy options exist to address jobless recoveries, they do not come without costs. For example, a reduction in consumer or business confidence can reduce the willingness of consumers and firms to spend, diminishing the multiplier. Increased government spending can lead to greater debt and higher interest rates, which can crowd out private consumption and investment. Therefore, the intended effects of fiscal policy are mitigated. Further, increased money supply and quantitative easing programs can lead to inflation in the long run, as more money chases an economy’s output. Such effects can mitigate the long-
In sum, the potential consequences of using expansionary fiscal and monetary policies to reduce the unemployment rate are higher debt and potential inflation, important issues to which we turn next.
Will Rising Debt and Future Debt Obligations Lead to Inflation?
Much of the debate among policymakers in recent years has centered on rising deficits and national debt. Indeed, fiscal deficits and national debt (at least in nominal terms) have risen to levels not seen in our history. The concern over debt has changed the politics in Washington, as a bitter debate ensued regarding the use of expansionary policies (such as stimulus spending and quantitative easing) to promote economic growth versus austerity measures (cost cutting) to reduce the deficit and the burden of the debt on future generations.
Rising Future Debt Obligations: Health Care and Social Security Even if the current deficits are brought under control using a combination of government spending cuts and tax increases, the long-
As greater numbers of baby boomers (those born in the years following the end of World War II) retire, more will begin receiving Social Security and Medicare benefits. In addition to greater numbers of beneficiaries, the cost of the benefits also rises. Social Security benefits increase based on the rate of inflation, while Medicare payments rise as the cost of health care increases.
Recent legislation has slowed the rise in health care costs, but the overall cost remains difficult to sustain in the long term. In addition, the long-
The Cost of Financing Debt The cost of financing debt depends on the interest rate. Fortunately, the United States has enjoyed very low interest rates for much of the past decade. This not only helps individuals and firms looking to borrow, but also the government in financing its debt. A new 30-
686
Another factor in the cost of financing debt is the willingness of countries to hold U.S. debt. Part of this depends on the demand for the U.S. dollar. The U.S. dollar remains the most widely held currency in the world. When U.S. dollars are held by foreigners, this amounts to an interest-
The Effects of Debt on Inflation Addressing debt can be undertaken with fiscal policy as well as monetary policy. Fiscal policy to curb debt includes raising taxes or reducing government spending. However, neither of these policies is popular, especially the reduction of Social Security or health care benefits that make up over 50% of government spending. Further, contractionary fiscal policy can curtail economic growth, which is especially dangerous when recovering from a severe recession. For this reason, policymakers have turned to monetary policy.
monetized debt Occurs when debt is reduced by increasing the money supply, thereby making each dollar less valuable through inflation.
One of the dangers of using monetary policy to help address deficit and debt issues occurs with monetized debt, which is debt that is paid for by an increase in the money supply. In other words, debt is reduced by way of a lower real value of the dollar. Because U.S. Treasury securities have long been sought after as a safe investment by individuals, firms, as well as governments around the world, the U.S. government has not had to worry about the inflationary effects of its monetary policy in recent years.
ISSUE
Inflating Our Way Out of Debt: Is This an Effective Approach?
In late 2012, the news media posted headlines about the possibility of the Fed authorizing the minting of a trillion dollar coin that would be used to pay for most of the year’s fiscal deficit. By doing so, the minted coin would be sent to the U.S. Treasury to pay down the debt. Would such a strategy really work? Would there be any effects on the economy or on ordinary Americans?

Although this type of policy is highly unlikely to occur (though more than one prominent economist had endorsed the plan), what may surprise you is that the Fed has used similar types of policies for years to address our rising national debt.
When the money supply is increased, the Fed is using money that is created out of thin air to purchase treasury bonds (debt) from banks and other institutions. In other words, part of the government’s debt is held by other parts of the government using money it creates through its power to print money. Does this sound like an easy solution?
Certainly, it’s easier than implementing fiscal policies to combat debt, which would require the raising of taxes or the reduction of government spending, neither of which is popular, especially when much of government spending is used for our national defense or to take care of our senior citizens. Therefore, the government has relied more on monetary policy. When money is created to purchase debt instruments, this is referred to as monetizing debt.
Recall that money is neutral. When more money chases a fixed output, prices must rise. Because aggregate demand was depressed after the last recession, inflation did not immediately rise. However, as consumer and business confidence improve, all of the money sitting on the sidelines will eventually enter into the economy and drive prices higher, leading to inflation. As inflation rises, the real value of the national debt falls.
Who, then, ends up paying for this reduction in debt caused by inflation? The answer is everyone who holds dollar-
687
However, should world demand for U.S. Treasury securities fall as countries diversify their holdings to other assets (such as euro-
In order to stem the effects of higher inflation, contractionary monetary policy is needed once the economy has recovered enough to withstand an increase in interest rates. Such policies are not popular. In late 2015, the Fed started to raise interest rates, but very slowly to avoid scaring investors who worried about the start of another recession. Still, controlling inflation is the key to preventing more serious problems for the economy. Ultimately, a higher inflation rate may hinder productivity and economic growth.
Will Globalization Lead to Increased Obstacles to Economic Growth?
Economic growth has been the driving force in improving our standard of living. However, the world is changing, and emerging countries such as China and India have experienced higher growth rates than the United States, Japan, and countries in Europe over the past two decades. Further, smaller developing countries, such as Gabon, Ethiopia, and Vietnam, have seen stellar growth rates that have pulled millions out of poverty.
Why has economic growth spread throughout the world in this way, and what does this entail for developed nations such as the United States?
One of the most important changes to the world economy over the past generation has been the dramatic increase in international trade, international factor movements (foreign investment and immigration), offshoring (the movement of factories overseas), and international banking. The integration of the world’s economies has allowed more countries to specialize and reap the gains from trade that result.
For developed countries such as the United States, Japan, and countries in Europe, increased globalization means increased competition for resources, especially talented labor, which now has many more opportunities than it did in the past. Therefore, pressures to innovate and to increase productivity have increased with globalization.
What does this mean for macroeconomic policy? Not only does fiscal and monetary policy need to be tailored to fit the problems inherent in our own country, but how these policies affect other countries becomes important as well.

Fiscal policies such as implementing trade restrictions or providing support for domestic industries tend to help one country at the expense of its trading partners. Taking these policies too far may encourage other countries to take similar actions, which would lead to fewer exports and a reduction in trade and economic growth.
Monetary policies also affect other nations through trade and the exchange rate. Expansionary monetary policy, such as reducing the interest rate, has the effect of lowering the value of one currency against others. When this occurs, the price of imports rises and the price of exports falls, helping to improve the trade balance as consumers react by purchasing more domestically produced goods than foreign-
We turn our attention in the next two chapters to international trade and open economy macroeconomics. Both chapters deal with how countries interact with other countries, either through the trade of goods and services or through the exchange of currencies. Both have important implications for the ability of countries to grow and to improve their standards of living.
688
Life on the Autobahn: Germany’s Role in European Growth and Stability
How did Germany maintain a strong economy after its reunification in 1990 and then in a Eurozone that faced many financial crises?
The autobahn has long been a symbol of Germany’s quest for economic strength and prosperity. Led by its successful auto industry, Germany has achieved much economic growth over the last 50 years, and its corporate brands are among the most recognizable and respected in the world. Even more remarkable is how Germany withstood many challenges over the last 30 years that tested its ability to maintain its economic strength.
What are some major events that shaped Germany’s economy over the last 30 years?

One major test of Germany’s resilience came with the fall of the Berlin Wall in 1989 and the reunification of West Germany with East Germany in 1990. At the time of reunification, West Germany’s GDP per capita was more than twice that of East Germany. Despite vast economic differences, the reunified Germany invested heavily in capital improvements in the East where marginal returns to capital were strong, increasing labor productivity that led to rising incomes.
Another major test was the formation of the European Union, which allowed workers and capital to move between member countries, along with the introduction of the euro, which merged the monetary policies of countries with different economic conditions. When nearly half of Eurozone members faced financial crises between 2008 and 2013, Germany led the European Central Bank’s efforts to increase lending while mandating reforms to put countries back on a path to growth.
Finally, Germany played a vital role in the resettlement of refugees and migrants that began flooding into Europe in 2015 to escape war and/or poverty. In 2015 Germany accepted more than 1 million asylum seekers. Germany demonstrated its ability to show compassion to the plight of others while continuing to maintain economic growth and low inflation.
Today, Germany remains a strong economic power that embraces diversity and has become a land of opportunity for many in a time when other countries are shutting their doors. It is a symbol of globalization that has given millions a new chance at life.
CHECKPOINT
MACROECONOMIC ISSUES THAT CONFRONT OUR FUTURE
No single macroeconomic model can solve all economic problems.
Jobless recoveries are spurred by increases in labor productivity, changes in employment patterns, and increased use of offshoring. Fiscal and monetary policies provide incentives to consume and invest, leading to job growth.
Rising deficits were caused by expansionary fiscal policies used to stem the effects of the financial crisis. Future concerns of deficits and debt center on the rising costs of Social Security and Medicare, making the use of fiscal policy to mitigate rising debt difficult.
Rising interest rates in the future will increase borrowing costs, making it more difficult to finance debt. Increased use of expansionary monetary policy can lead to long-
run inflation, reducing the debt burden but also reducing the purchasing power of savings. Globalization has led to economic growth throughout the world, especially in developing countries. However, increased competition from abroad has made it more challenging for developed nations to maintain high growth rates over time.
QUESTIONS: In 2009 inflation was negative (also known as deflation); average prices fell mostly due to a sharp decline in consumer spending and business investments from the recession. In early 2015, deflation occurred again, but this time it was caused by a sharp drop in energy prices. How does deflation affect the ability of households and businesses to manage debt? Does the cause of the deflation matter? Explain.
Answers to the Checkpoint questions can be found at the end of this chapter.
Deflation causes the real value of debt to rise, making it more difficult to repay. Yes, it does matter how the deflation occurs. In 2009 deflation resulted from a decrease in aggregate demand (from a decline in consumption and investment), causing both prices and output to fall. In 2015 deflation resulted from an increase in the short-