TAXES AND ELASTICITY
On average, families pay more than 40% of their income in taxes, including income, property, estate, sales, and excise taxes. (An excise tax is a sales tax applied to a specific product, such as gasoline or tobacco.) Add to this the taxes that are embedded into the goods and services we buy, such as tariffs (taxes) on imports, tourism taxes, and airport security taxes, and it’s no wonder that taxes are a perennial issue of debate among policymakers and their constituents.
Nobody likes paying taxes, but they are necessary to provide many of the public goods and services (such as roads, national defense, police protection, public education, clean air, and parks) from which everybody receives some benefit. The questions economists deal with are how to determine the efficient level of taxation and what is the most efficient way to reach that level.
Taxes can be separated into two general categories: taxes on income sources and taxes on spending. We now study how the economic burden of both categories of taxes can vary depending on how the tax policy is designed (in the case of income) and on the elasticity of the good or service being purchased (in the case of spending).
We begin by studying the various ways taxes are collected on income.
Taxes on Income Sources and Their Economic Burden
123
Taxes on income sources constitute the largest source of revenues for the federal government and many state governments. The most common types of taxes include individual income tax, payroll tax (such as FICA, also known as the Social Security tax), corporate income tax, dividend tax (taxes on earnings from financial assets), and capital gains tax (taxes on the rising values of assets such as property and financial instruments when sold).
progressive tax A tax that rises in percentage of income as income increases.
flat tax A tax that is a constant proportion of one’s income.
regressive tax A tax that falls in percentage of income as income increases.
lump-
Much of the debate on the economic burden of income taxes focuses on whether taxes are progressive, flat, or regressive with respect to income earned. Progressive taxes are those that rise in burden as income increases. Flat taxes take a constant percentage of one’s income. Regressive taxes fall in burden as income increases, which means that individuals with lower incomes pay a greater percentage of their income in taxes than individuals with higher incomes. A type of regressive tax is called a lump-
| TABLE 3 | TYPES OF TAXES AND THEIR ECONOMIC BURDEN | |||
| Type of Tax | Example | Description of Tax Burden | ||
| Progressive | Individual income tax |
As income rises, income is taxed at a higher percentage rate when a higher tax bracket is reached. | ||
| Flat | Medicare tax | Medicare tax is 2.9% of all income earned (half of which is paid by employees and half paid by employers). | ||
| Regressive | FICA tax | The FICA tax is a flat tax of 6.2% paid by both employees and employers up to an income cap and is used to fund Social Security. Those earning above the cap will pay a lower overall percentage of income in payroll taxes. | ||
Taxes on Spending and the Incidence of Taxation
The typical household pays a substantial amount of taxes on goods and services. Almost everybody pays taxes on goods and services purchased, homeowners pay property taxes each year on the value of their homes, and all sorts of excise taxes exist on everything from car rentals and hotel stays to gasoline and wireless service plan purchases.
Although income taxes typically represent the largest burden on most households, taxes on spending are sometimes larger for certain groups of people. For example, households with very low incomes often pay little to no income taxes, but pay a sizeable portion of their income in sales and excise taxes. Similarly, wealthy households often receive most of their income by way of investment earnings, which are taxed at a lower rate than traditional income earnings. For these households, taxes paid on property (often on multiple homes) and luxury taxes (on yachts and other expensive toys) may constitute a larger portion of their tax burden.
incidence of taxation Refers to who bears the economic burden of a tax. The economic entity bearing the burden of a particular tax will depend on the price elasticities of demand and supply.
In sum, taxes on spending are not trivial, and elasticity plays an important role in determining the impact of these various taxes on individuals and businesses. Economists studying taxes are interested in the incidence of taxation, which refers to who bears the economic burden of a tax. Although statutes determine what is taxed and who must pay various taxes, the individuals or businesses paying a tax may not be the ones bearing its economic burden. This burden can be shifted onto others.
Let’s analyze how the elasticity of a good or service can affect the incidence of taxation. To simplify the analysis, we will focus on excise taxes.
Analyzing the Effect of Taxes on a Market
124
Let us consider what happens when an excise tax is levied on a product such as airline tickets. Panel A of Figure 7 shows the market before an excise tax is imposed. The initial supply curve S0 is supply before the tax and demand curve D0 reflects demand. The market is in equilibrium at point e, at which 3,000 tickets are sold for $200 each. At equilibrium, consumer and producer surplus are substantial, with no deadweight loss because the market is operating efficiently.
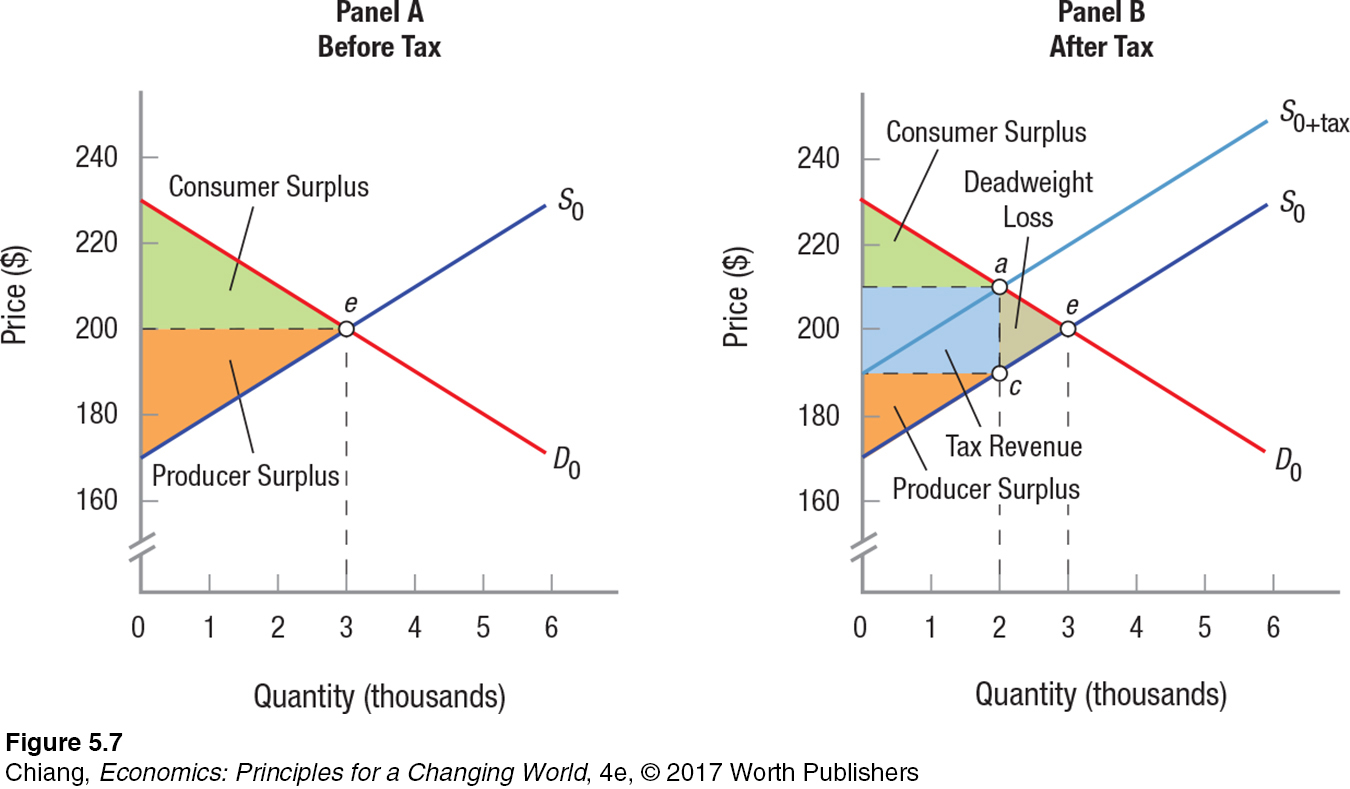
In panel B, we now add a per unit tax of $20 paid by the airline. This, in effect, adds $20 to the cost of each airline ticket and adds a wedge between what consumers pay and what airlines receive. Supply curve S0 therefore shifts upward by this amount, to S0 + tax. The new supply curve runs parallel to S0, with the distance the curve has shifted (ac) equaling the $20 tax per ticket collected by the government.
Assuming demand remains constant at D0, the new equilibrium is at point a, with 2,000 tickets sold for a price of $210. The airline receives $210 per ticket, of which it must send $20 to the government, keeping $190 for itself. In this case, the airline shifted half of the tax burden ($10 of the $20 tax) onto consumers. Meanwhile, the government collects the $20 tax on the 2,000 tickets. This amount ($20 × 2,000 = $40,000) is represented by the blue area. Consumer surplus now equals the area above the blue section, and producer surplus equals the area below it. Note that consumers and producers lose surplus equal not only to the revenue gained by the government but also to area cae, which represents a deadweight loss. Although this area is lost to society as a result of the tax, how the tax revenues are used to benefit society determines whether society is better or worse off with the tax.
In this example, consumers and producers share the tax burden equally, but that is not always the case, as we’ll see next.
125
When Elasticity Puts a Greater Burden of a Tax on Consumers
Earlier in the chapter, we learned that inelastic demand means that consumers react less strongly to price changes, while elastic demand means that consumers react strongly to price changes. The same is true of how producers react when supply is inelastic or elastic. Using this knowledge, we can examine how consumers and producers react when prices of goods and services change due to a tax.
Figure 8 shows a market for sparklers, one in which consumer demand is inelastic, while supply is relatively elastic. In this situation, how would a tax affect the equilibrium price in this market? Like our previous analysis, the supply curve S0 shifts to S0+tax, moving the equilibrium point from e to g at a new equilibrium price of $4.00.
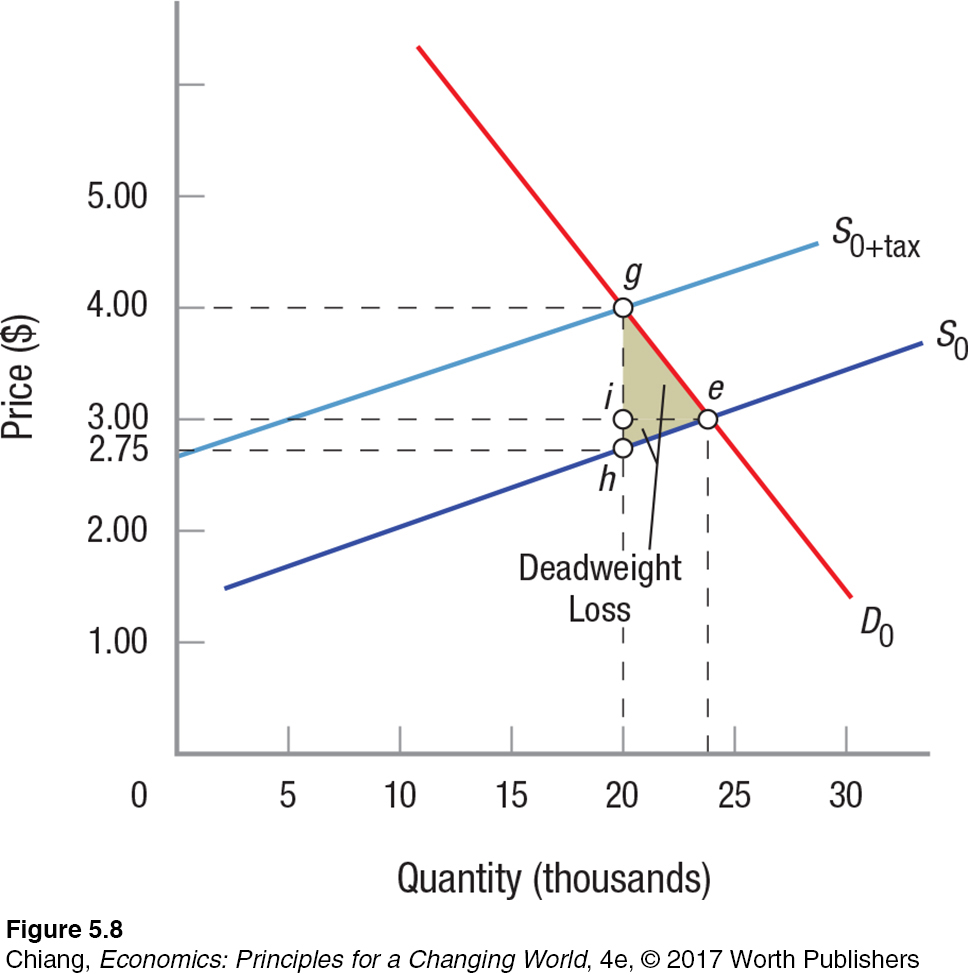
Compared to the equilibrium prior to the tax, consumers pay an additional $1.00 for each unit, but producers end up bearing a much smaller burden of 25 cents. Because consumers were less sensitive to changes in prices than producers, producers were able to shift a greater portion of the tax forward to consumers.
Therefore, we can generalize about the effects of elasticity on the tax burden as follows: For a given supply of some products, the lower the price elasticity of demand, the greater the share of the total tax burden shifted to consumers. Likewise, for a given demand of some products, the higher the price elasticity of supply, the greater the share of the total tax burden shifted to consumers. In sum, when demand for a good is inelastic while the supply of a good is elastic, consumers will end up bearing most of the burden of a tax.
When Elasticity Puts a Greater Burden of a Tax on Producers
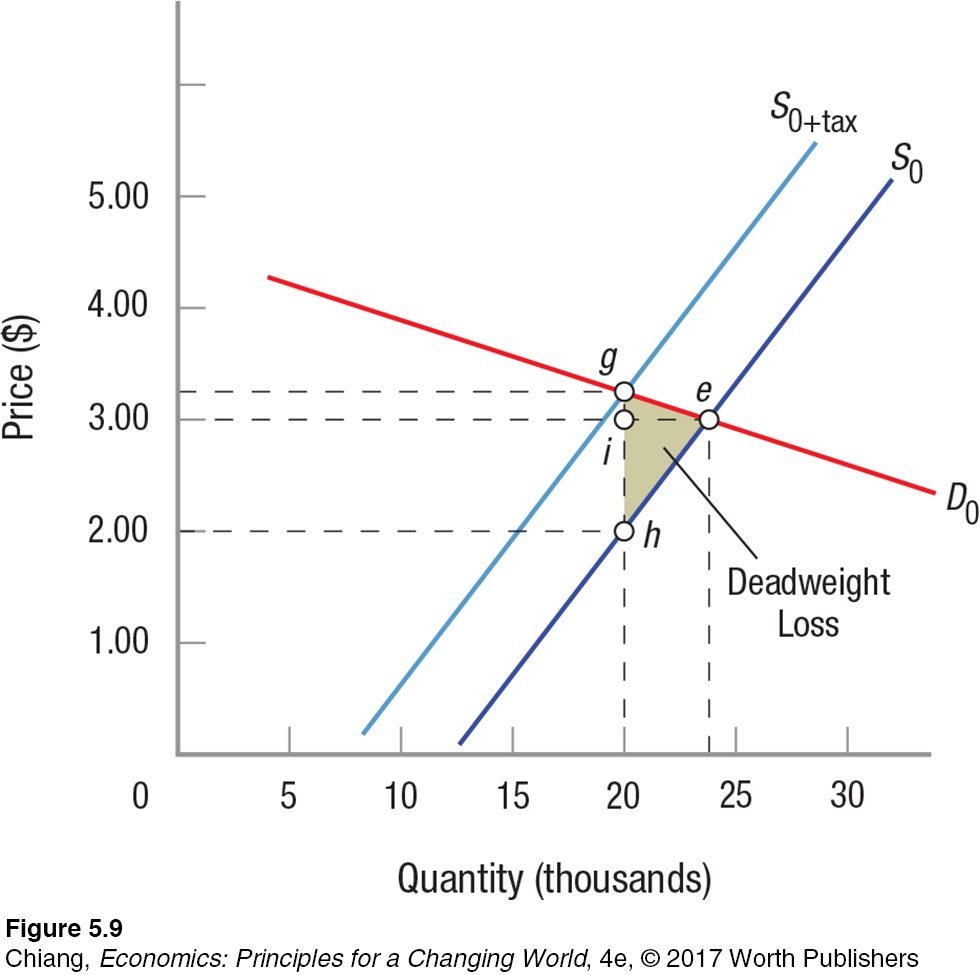
Naturally, if inelastic demand and elastic supply shift the tax burden toward consumers, the opposite would be true when demand is elastic and supply is inelastic. Figure 9 again shows the market for sparklers, but this time demand is relatively elastic (flat) while supply is relatively inelastic (steep). When an excise tax of $1.25 per unit is levied, the equilibrium moves from point e to g. At the new equilibrium, consumers pay $3.25 per unit (or 25 cents per unit more than before the tax), while producers receive $2.00 per unit (or $1 per unit less than before the tax). In this case, because consumers are more sensitive to price changes, producers are less able to shift the tax to consumers, resulting in producers bearing the majority of the tax burden.
126
Norway: An Oil Producing Nation With an Incentive NOT to Drive
How are the preferred modes of transportation in Norway and Saudi Arabia affected by the way that each country has influenced retail gas prices?

Gasoline prices vary around the world, but not necessarily for the same reasons. Oil-
Norway is one of the world’s largest oil producers, with its rich oil fields in the Baltic Sea. But unlike Saudi Arabia, where a gallon of gas costs around 45 cents, the Norwegian government taxes gasoline heavily. In Norway, a gallon of gasoline costs about $10! The consequence of high gas prices is that the streets of Oslo, the capital and largest city, are mostly free of traffic as many of its citizens use its efficient public transportation or choose to ride bicycles, even in the cold Norwegian winters.
Elasticity plays an important role in how consumers respond to changes in gasoline prices. Although changes in prices may not lead to immediate changes in how people use their cars, over time, elasticities will rise as more alternatives become available. In the case of Norway, the alternatives were developed more quickly due to the rapid increase in prices.
GO TO  TO PRACTICE THE ECONOMIC CONCEPTS IN THIS STORY
127
Just like the previous example, we can generalize about the effects of elasticity when it causes a larger tax burden on producers. The higher the price elasticity of demand and the lower the price elasticity of supply, the lower the share of the total tax burden shifted to consumers. Therefore, when demand for a good is elastic while the supply is inelastic, producers will end up bearing most of the burden of a tax.
Note what happens in all of the tax cases described. Figure 7, Figure 8 and Figure 9 show that whenever a tax is added, the tax moves the market away from its equilibrium point, regardless of whether the tax is borne by consumers, producers, or both. All taxes generate a tax wedge, resulting in a deadweight loss to society. Does deadweight loss vary based on elasticity?
128
ISSUE
Are Sales Taxes Fair to Low-
With few exceptions, sales taxes are added to the price of nearly everything we buy. Sales taxes vary by state, and can also vary by cities or counties within states. Unlike income taxes, for which the tax rate changes as income rises, sales taxes are a fixed percentage of one’s total purchase. For example, in the state of New Jersey, with a sales tax rate of 7%, you would pay $3.50 in sales tax if you bought a watch that sells for $50. Because of this fixed percentage, sales taxes are often referred to as a flat (or proportional) tax, because the tax rate remains constant regardless of the amount purchased. But is this an accurate depiction of the economic burden of sales taxes?
Many economists argue that sales taxes are regressive in nature, meaning that households with lower incomes pay a greater share of their income in sales taxes than households with higher incomes. Such claims have led some economists to vehemently oppose legislation that proposes higher sales taxes as a way to increase state tax revenues.
To measure the burden of sales taxes, one must first analyze how households spend their money. For example, a household earning $25,000 a year spends approximately $5,500 on items subject to the sales tax. These expenditures include most goods (except groceries in many states), auto lease payments, and many services. Major items not subject to sales taxes include rent and mortgage payments, tuition payments, and most financial instruments. Using an average sales tax rate of 7%, this household would spend $385 a year on sales taxes, or 1.54% of total income. A household earning $100,000 a year, however, spends approximately $18,000 on taxable items. This amounts to $1,260 a year in sales tax, or 1.26% of total income. Therefore, sales taxes are regressive.

How do states compare in terms of the average sales tax rate? The following table shows the ten states with the highest average sales tax rate and the ten states with the lowest. Surprisingly, the four states with the highest sales tax rates, Tennessee, Arkansas, Louisiana, and Alabama, are those with lower average incomes. This creates a double whammy—
In sum, when municipalities and states need to raise revenue, the sales tax is the type of tax that hurts the poor the most. Therefore, a few states have opted not to use sales taxes at all, and instead rely on state income taxes, corporate taxes, or property taxes that are progressive, meaning that those with higher incomes pay a greater percentage in taxes. But for most states, sales taxes remain an important source of revenues.
| Highest Average Sales Tax Rate | Lowest Average Sales Tax Rate |
| 1. Tennessee (9.46%) | 41. Virginia (5.63%) |
| 2. Arkansas (9.30%) | 42. Maine (5.50%) |
| 3. Louisiana (9.00%) | 43. Wyoming (5.42%) |
| 4. Alabama (8.97%) | 44. Wisconsin (5.41%) |
| 5. Washington (8.89%) | 45. Hawaii (4.35%) |
| 6. Oklahoma (8.82%) | 46. Alaska (1.78%) |
| 7. Illinois (8.64%) | 47. (tied) Delaware (0.00%) |
| 8. Kansas (8.60%) | 47. (tied) Montana (0.00%) |
| 9. New York (8.49%) | 47. (tied) New Hampshire (0.00%) |
| 10. California (8.48%) | 47. (tied) Oregon (0.00%) |
| Source: Tax Foundation, 2016. (Percentages are state sales tax rate + average local sales tax rate.) |
Generally, the more elastic the demand or supply, the greater is the total deadweight loss to society. Why is that? We can deduce this intuitively by understanding that higher elasticities indicate a larger response by both consumers and producers in terms of the quantity demanded and supplied, respectively. Therefore, larger responses to price changes tend to move the equilibrium quantity farther from the pre-
The last three chapters have given us the powerful tools of supply and demand analysis. Elasticity is important because it captures the complex relationships among prices, quantity demanded, and total revenues in just two words: “elastic” and “inelastic”. When demand is inelastic and some incident marginally reduces supply, policymakers (and now you) know that price will go up substantially, although consumers will continue to purchase the product. Again, this is what happens when any inelastic product rises in price. When tuition increases, students continue to purchase roughly the same number of credits as before; thus, revenues collected by universities rise substantially in the short run.
If, however, demand is elastic and the same incident reduces supply, prices will rise, but by a smaller amount, and output and employment will fall a lot more. If weather conditions in California and Florida ruin the orange crop, reducing the supply and increasing the price of orange juice, consumers will readily substitute other juices. As a result, output, employment, and revenues will decline in the orange industry.
CHECKPOINT
TAXES AND ELASTICITY
Taxes on income can be progressive, flat, or regressive based on the percentage of income that is paid in taxes. Most income taxes are progressive, but certain forms of flat and regressive taxes exist.
When price elasticity of demand is elastic, consumers bear a smaller burden of taxes while more is borne by sellers. When demand is inelastic, a higher share of the total tax burden is shifted to consumers.
When the price elasticity of supply is elastic, buyers bear a larger burden of taxes. Elastic supply also leads to a larger deadweight loss. When supply is inelastic, more of the tax burden is shifted to sellers, but the deadweight loss is lower.
QUESTION: Excise taxes were the principal taxes levied in the United States for the first 100 years or so after the Revolutionary War. Today, excise taxes fall mainly on cigarettes, liquor, luxury cars and boats, telephones, gasoline, diesel fuel, aviation fuel, gas-
Answers to the Checkpoint questions can be found at the end of this chapter.
They all appear to have relatively inelastic demands. This reduces the impact of taxes on the industries and leads to higher tax revenues.
129