FIGURE 3 THE IMPACT OF A CHANGE IN THE MONEY SUPPLY IN THE LONG RUN: THEORY AND EVIDENCE
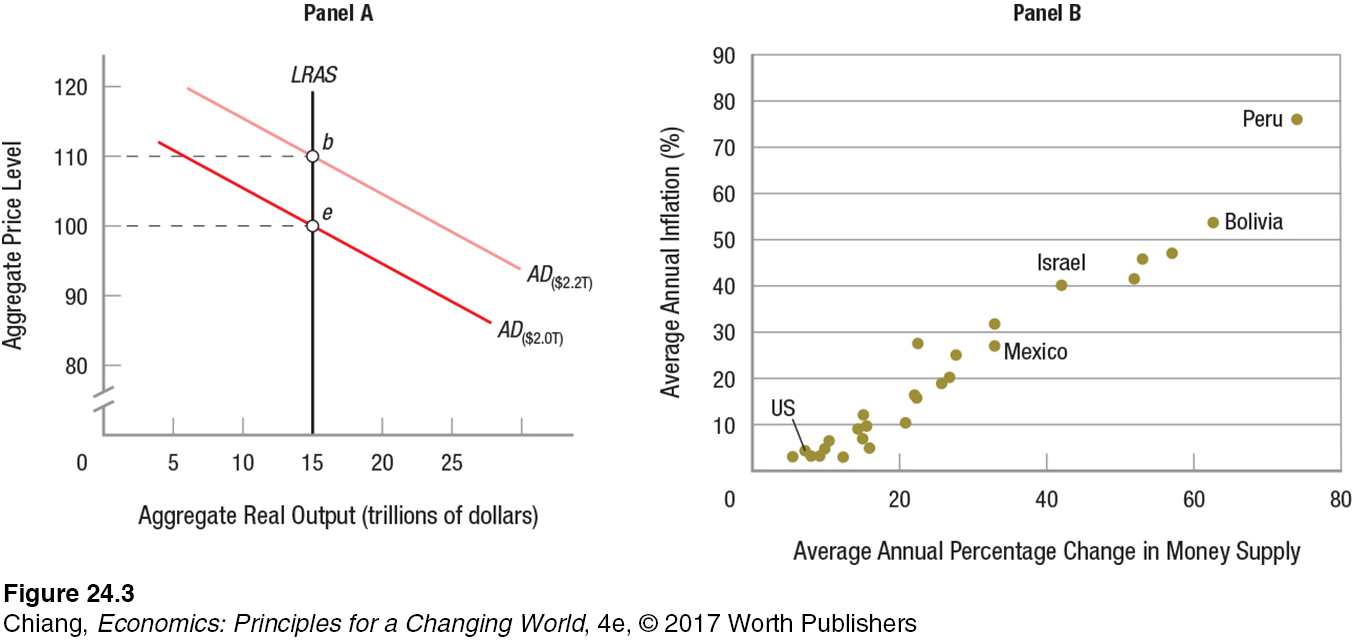 The quantity theory of money is shown using aggregate demand and aggregate supply. The economy is initially in equilibrium at point e. The long-run aggregate supply curve is vertical at the full employment output of $15 trillion, while the aggregate demand curve reflects a money supply of $2.0 trillion. Increasing the money supply to $2.2 trillion (a 10% increase) shifts aggregate demand upward to AD($2.2T), resulting in a new equilibrium at point b, where the aggregate price level rises by 10%, yet real output remains constant. The price level rise is equal to the percentage increase in the money supply. Money supply growth and inflation for thirty countries from 1975 to 2015 support this theory.