chapter summary
76
chapter summary
Section 1 Markets
3.1 A market is an institution that enables buyers and sellers to interact and transact with one another.

Markets can be as simple as a lemonade stand, as large as an automobile lot, as valuable as the stock market, as virtual as an Internet shopping site, or as illegal as a ticket scalping operation.

Buyers and sellers communicate their desires in a market through the prices at which goods and services are bought and sold. Hence, a market economy is called a price system.

Section 2 Demand
3.2 Demand refers to the goods and services people are willing and able to buy during a period of time. It is a horizontal summation of individual demand curves in a defined market.
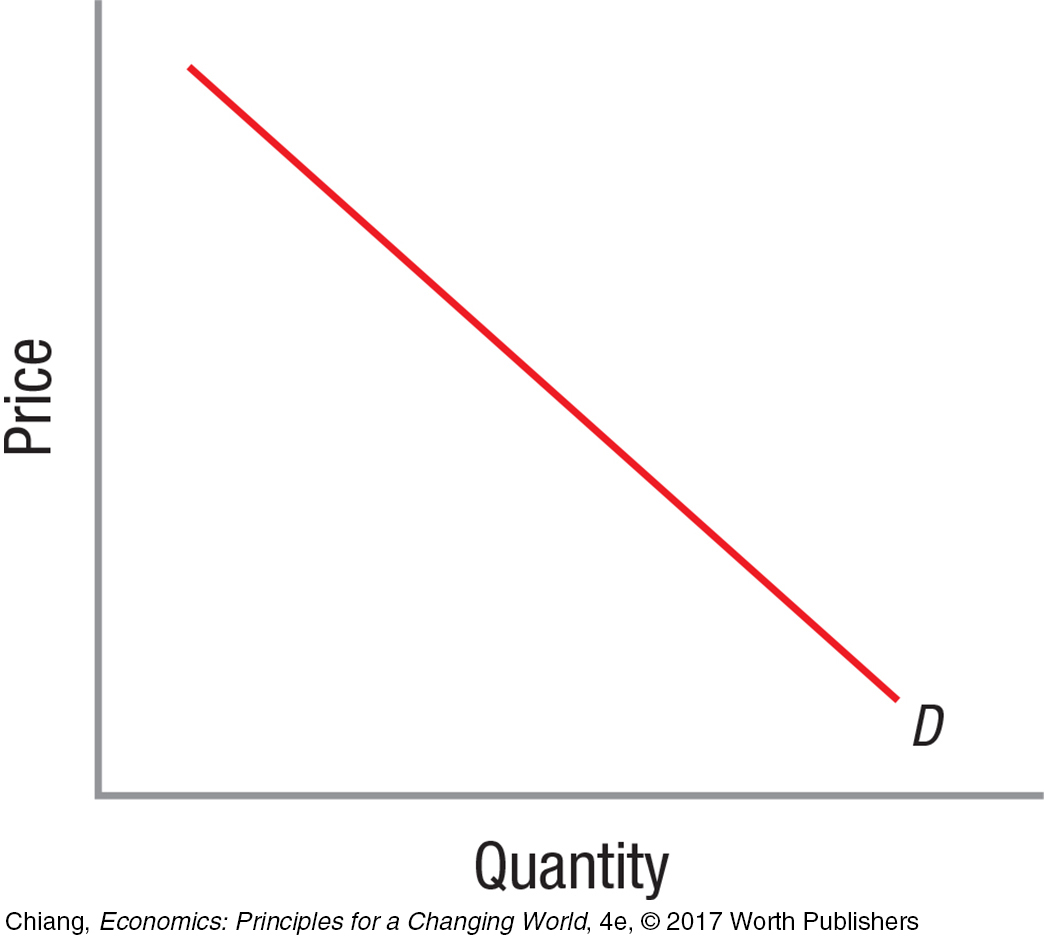
The law of demand states that as prices increase, quantity demanded falls, and vice versa, resulting in downward-
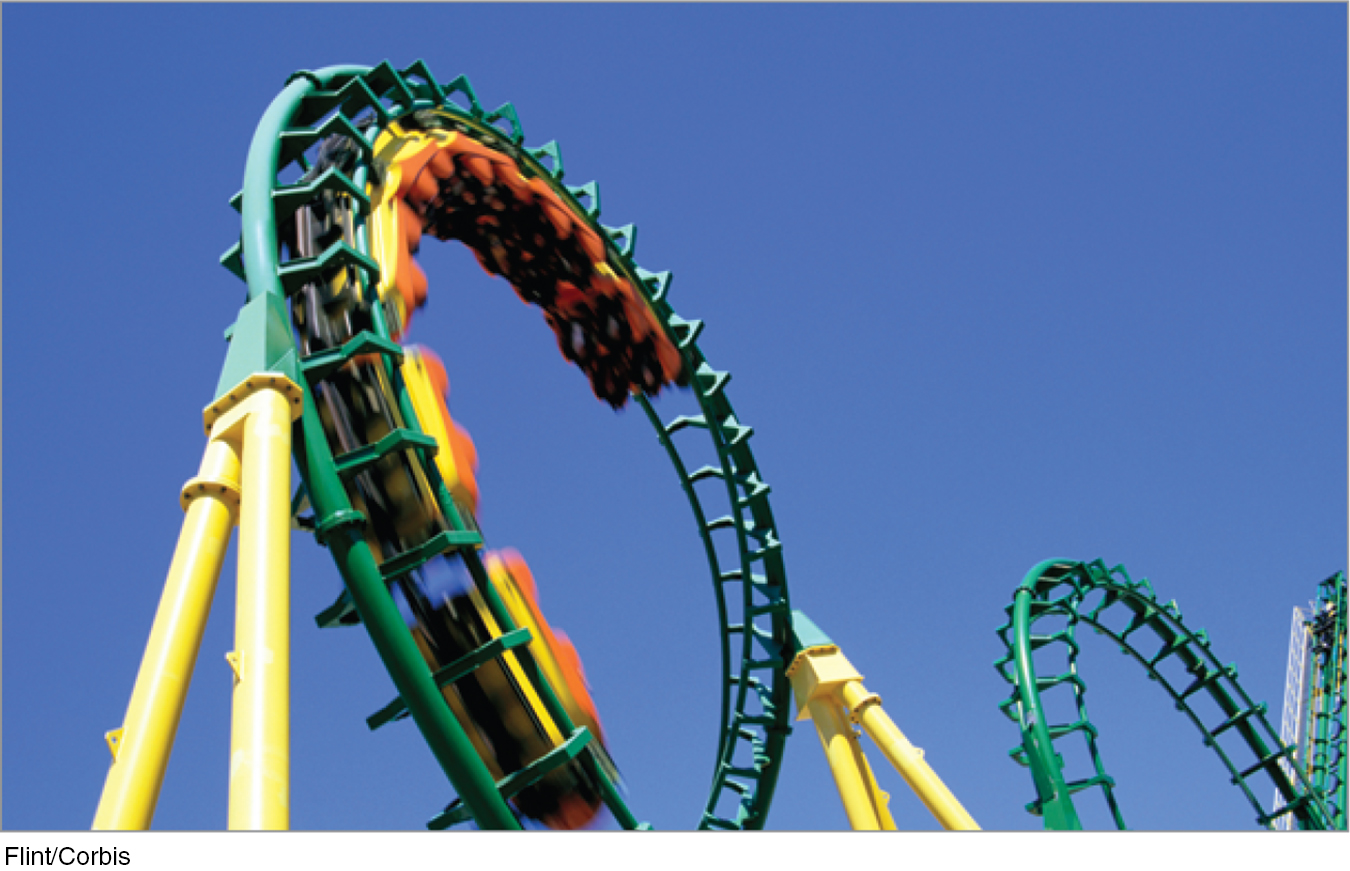
Roller coasters are a lot of fun, but riding the same one over and over gives less satisfaction with each ride; therefore, willingness-
3.3 Determinants of Demand: How Demand Curves Shift
↑ Tastes and preferences: Demand shifts right.
↑ Income: Demand for normal goods shifts right, while demand for inferior goods shifts left.
↑ Price of substitutes: Demand shifts right.
↑ Price of complements: Demand shifts left.
↑ Number of buyers: Demand shifts right.
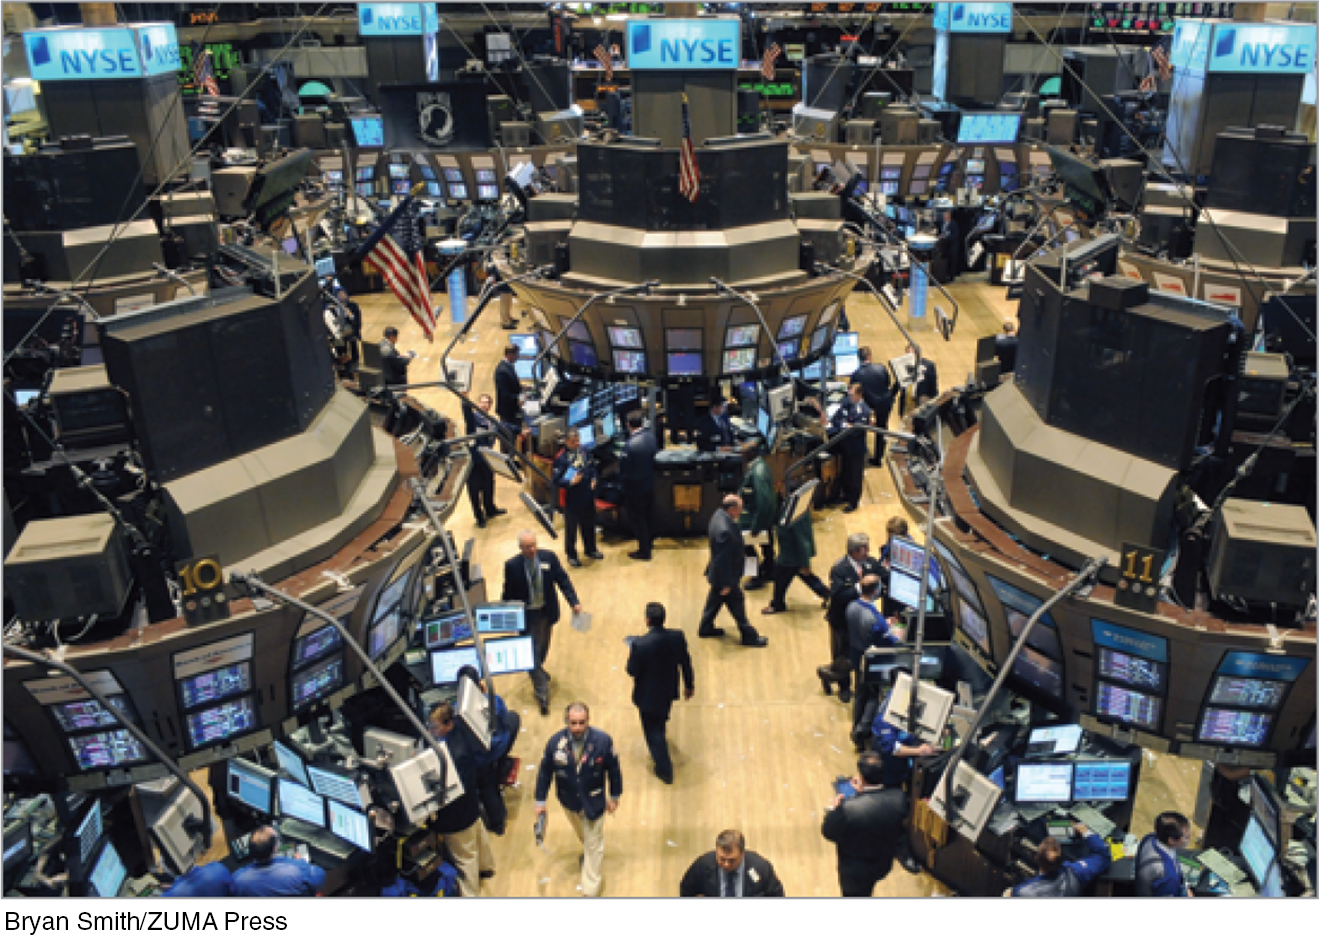
↑ Price expectations: Demand shifts right.
When investors expect stock prices to increase, demand for stock increases.
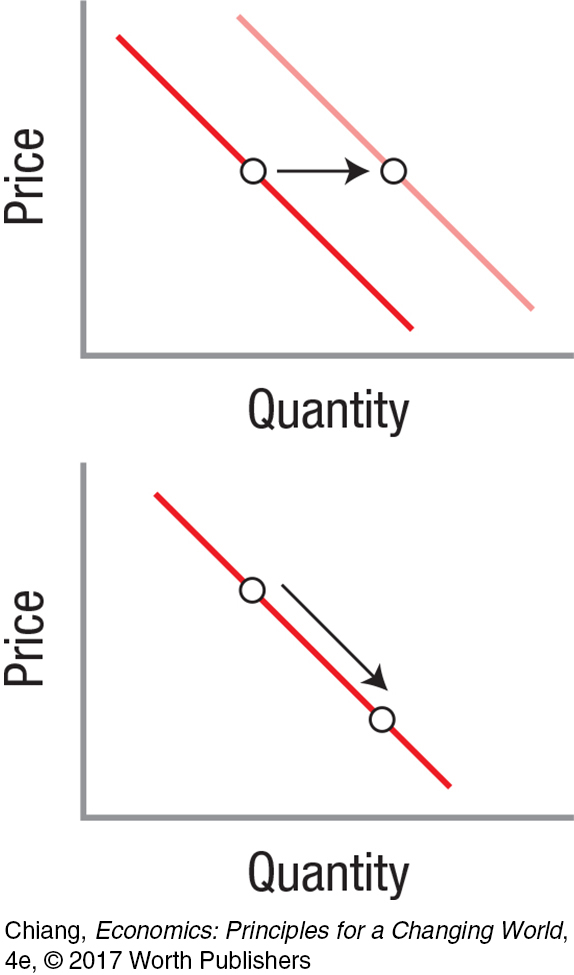
3.4 A Common Confusion in Terminology
A “change in demand” is a shift of the entire demand curve and is caused by a change in a nonprice demand factor.
A “change in quantity demanded” is a movement from one point to another on the same demand curve, and is caused only by a change in price of that good.
77
Section 3 Supply
3.5 Supply analysis works the same way as demand, but looking at the market from the firm’s point of view.
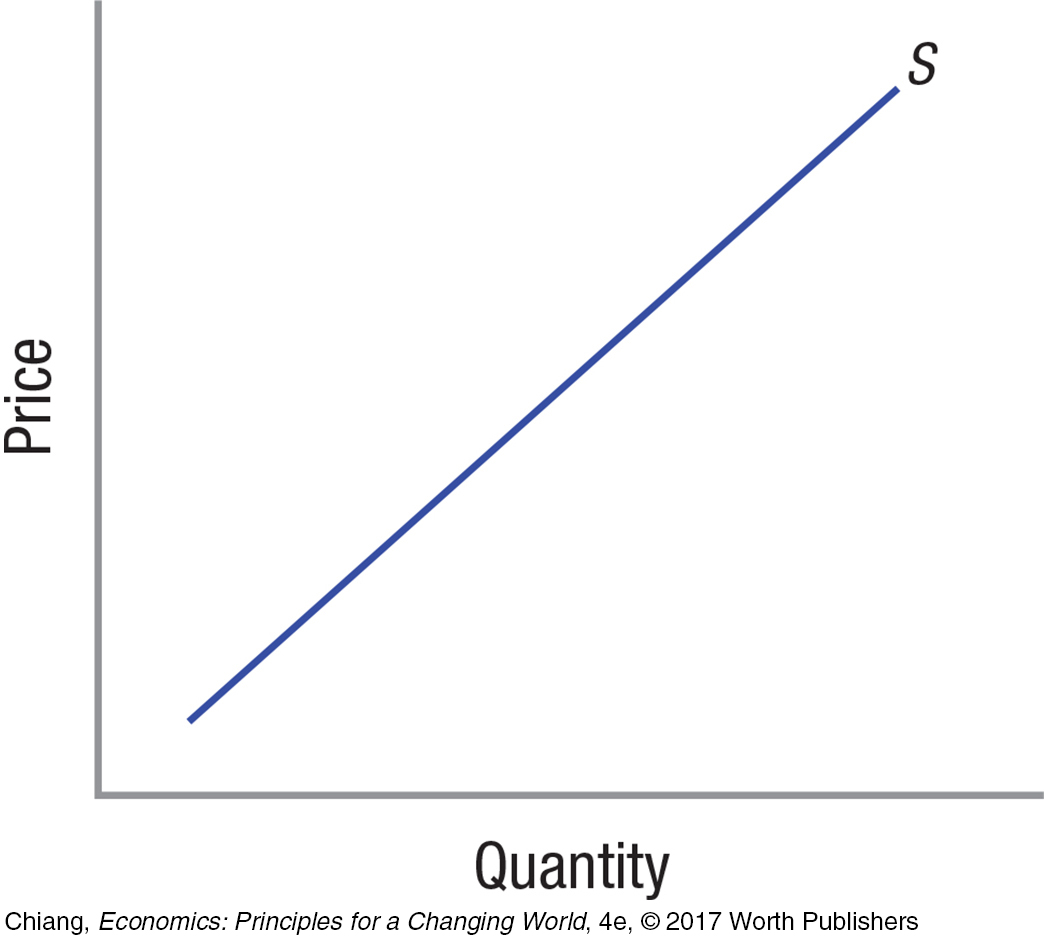
The law of supply states that as price increases, firms want to supply more, and vice versa. It leads to an upward-
3.6 Determinants of Supply: How Supply Curves Shift

↑ Production technology: Supply shifts right.
↑ Cost of resources: Supply shifts left.
↑ Price of related commodities: Supply shifts left.
↑ Price expectations: Supply shifts left.
↑ Number of sellers: Supply shifts right.
↑ Taxes: Supply shifts left.
↑ Subsidies: Supply shifts right.
Section 4 Market Equilibrium
3.7 Market equilibrium occurs at the price at which the quantity supplied is equal to quantity demanded, and where the demand and supply curves intersect.

3.8 A shift in demand or supply will change equilibrium price and quantity.

Higher oil prices raise the cost of resins used to produce surfboards.
Which curve slopes up and which slopes down? Two tricks to aid in memory:
S“up”ply contains the word “up” for upward-
sloping. Only the fingers on your right hand can make a “d” for demand. Hold that hand up in front of you!

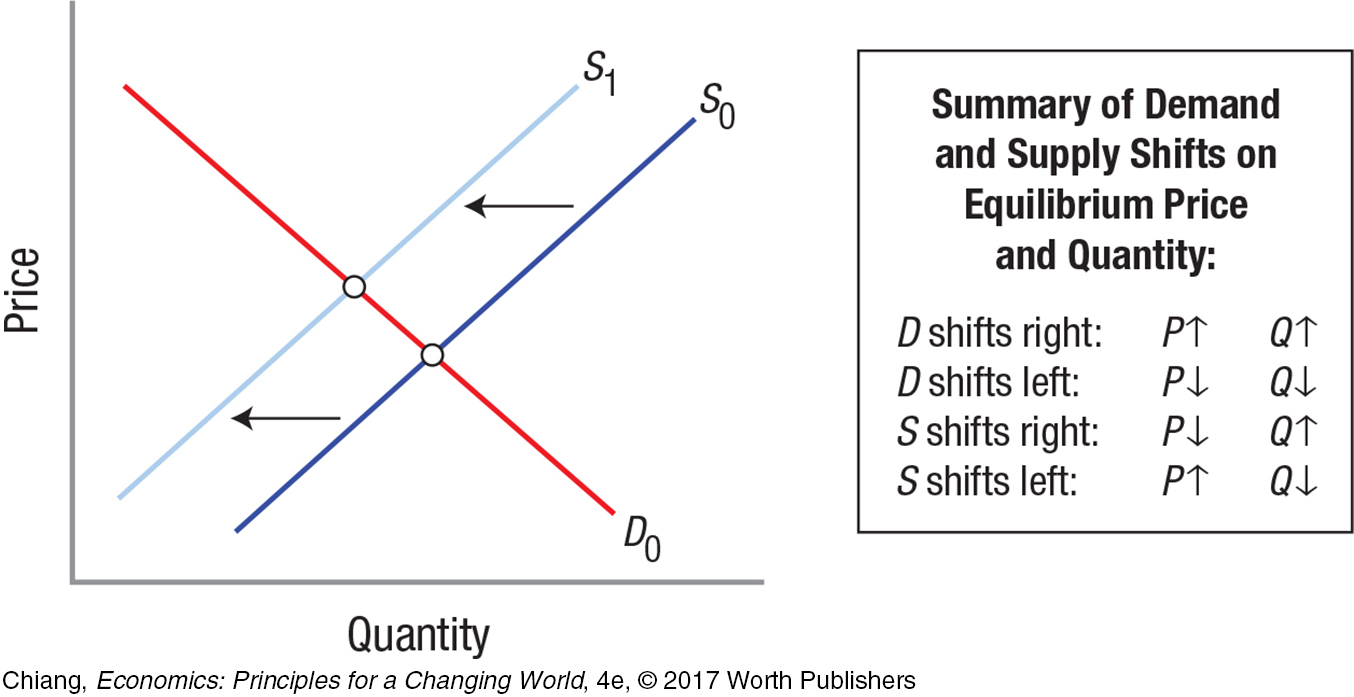
Supply of surfboards shifts left, raising equilibrium price and lowering equilibrium quantity.