COMPETITIVE LABOR SUPPLY
Economists divide your activities into two categories: work and leisure. When you decide to work, you are giving up leisure, understood broadly as nonwork activity, in exchange for the income that work brings. Economists assume people prefer leisure activities to work. This may not be entirely true, as work can be a source of personal satisfaction and a network of social connections, as well as provide many other benefits. For our discussion, however, we follow the practice of economists in dividing individual or household time into just work and leisure. Note that the term leisure encompasses all activities that do not involve paid work, including caring for children, doing household chores, and activities that are truly leisurely.
Individual Labor Supply
supply of labor The amount of time an individual is willing to work at various wage rates.
The supply of labor represents the time an individual is willing to work—
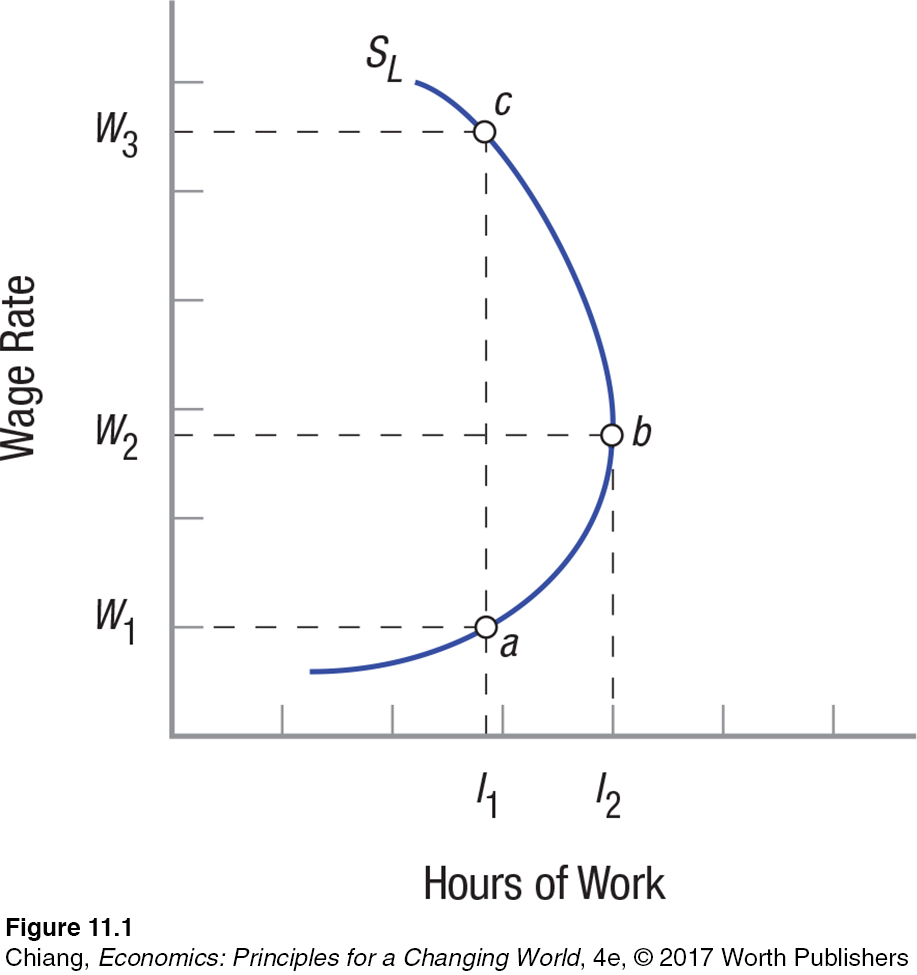
Figure 1 shows a typical labor supply curve for individuals. This individual is willing to supply l1 hours of work per day when the wage is W1. What happens if the wage rate increases? Assume that wages increase to W2: This individual now is willing to increase hours spent working from l1 to l2 (point b). But if the wage rate increases further to W3, this individual reduces the hours spent working back to l1 (point c). What determines how many hours a person is willing to work at each wage rate?
substitution effect Higher wages mean that the value of work has increased, and the opportunity costs of leisure are higher; hence, work is substituted in place of leisure.
Substitution Effect When wages rise, people tend to substitute work in place of leisure because the opportunity cost of leisure grows. This is known as the substitution effect. The substitution effect for labor supply is always positive; it leads to more hours of work when the wage rate increases.
Note that this effect is similar to the substitution effect consumers experience when the price of a product declines. When the price of one product falls, consumers substitute that product for others. The substitution effect for consumer products, however, is negative (price falls and consumption rises), while it is always positive for labor (wages rise and the supply of labor increases).
income effect Higher wages mean that you can maintain the same standard of living by working fewer hours. The impact on labor supply is generally negative.
Income Effect When wages rise, if you continue to work the same hours as before, your income will rise. As income rises, you have an ability to purchase more goods, including leisure. Thus, as wages rise to a level high enough to live the lifestyle you wish, you might desire to reduce the hours you work (besides, if you work too much, you won’t have time to enjoy spending the money you earned). This notion of working less (and consuming more leisure) as wages rise is known as the income effect. The income effect on labor supply is normally negative—
283
Both the substitution and income effects are present for all individuals, but at varying levels. The individual supply of labor, therefore, depends on which effect is stronger at each wage rate, and the individual labor supply curve is backward-
When the labor supply curve is positively sloped, as it is below W2 in Figure 1, the substitution effect is stronger than the income effect; income is more important than leisure at these wage levels; thus, higher wages lead to more hours worked. Conversely, when the supply of labor curve bends backward, as it does above W2, the income effect overpowers the substitution effect. In this case, higher wages mean fewer hours worked.
Backward-
Market Labor Supply Curves
The labor supply for any occupation or industry is upward-
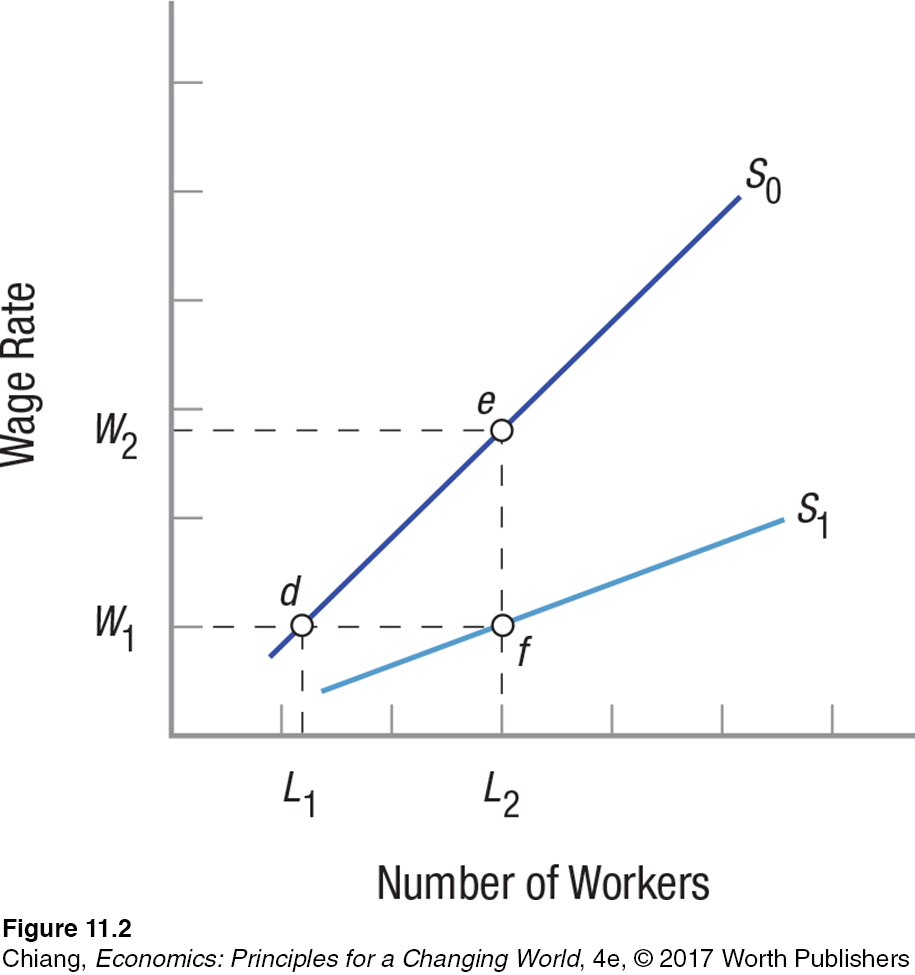
Changes in wage rates change the quantity of labor supplied. For example, increasing wages in one industry attract labor from other industries. This is a movement along the market labor supply curve, shown as a movement along S0 from points d to e as wages (input prices) rise from W1 to W2.
Factors That Change Labor Supply
What factors will cause the entire market labor supply curve to shift from, say, S0 to S1 in Figure 2 so that L2 workers are willing to work for a wage of W1 (point f )? These include demographic changes, nonwage aspects of jobs, wages paid in other occupations, and nonwage income.
284
Demographic Changes Changes in population, immigration patterns, and labor force participation rates (the percentage of individuals in a group who enter the labor force) all change labor supplies by altering the number of qualified people available for work.
Over the past three decades, labor force participation rates among women have steadily risen, continually adding workers to the expanding U.S. labor force; dual-
Another demographic change is the increasing portion of population growth in the United States resulting from immigration (both legal and illegal). An estimated 88% of net population growth over the next five decades will result from immigrants and their U.S.-born descendants.1 This will have a significant effect on the labor supply.
1 Pew Research Center, “Modern Immigration Wave Brings 59 Million to U.S., Driving Population Growth and Change Through 2065,” September 28, 2015.
Finally, other demographic changes have shifted the labor supply curve by modifying the labor−leisure preferences among workers. Health improvements, for example, have lengthened the typical working life, thereby increasing the supply of labor.
Nonwage Aspects of Jobs Changes in the nonwage aspects of an occupation will similarly shift the supply of labor in that market. If employers can manage to increase the pleasantness, safety, or status of a job, labor supply will increase. Other nonmoney perks also help. The airline industry, for example, has greatly increased the number of people willing to work in mundane positions by allowing employees to fly anywhere free.
Wages in Alternative Jobs When worker skills in one industry are readily transferable to other jobs or industries, the wages paid in those other markets will affect wage rates and the labor supply in the first industry. For example, Web site designers and computer technicians are useful in all industries, and their wages in one industry affect all industries. Because at least some of the skills that all workers possess will benefit other employers, all labor markets have some influence over each other. Rising wages in growth industries will shrink the supply of labor available to firms in other industries.
Nonwage Income Changes in income from sources other than working (such as income from a trust) will change the supply of labor. As nonwage income rises, hours of work supplied declines. If you have enough income from nonwork sources, after all, the retirement urge will set in no matter what your age.
285
The key thing to remember here is that market labor supply curves are normally positively sloped, even though an individual’s labor supply curve may be backward-
CHECKPOINT
COMPETITIVE LABOR SUPPLY
Competitive labor markets assume that firms operate in competitive product markets and purchase homogeneous labor, and that information is widely available and accurate.
The supply of labor represents the time an individual is willing to work.
The substitution effect occurs when wages rise, as people tend to substitute work in place of leisure because the opportunity cost of leisure is higher, or vice versa when wages fall.
When wages rise and you continue to work the same number of hours, your income rises. When wages rise high enough, an income effect occurs in which income is traded for leisure, and the supply of labor curve for individuals is backward-
bending. Industry or occupation labor supply curves are upward-
sloping. The labor supply curve shifts with demographic changes, changes in the nonwage aspects of an occupation, changes in the wages of alternative jobs, and changes in nonwage income.
QUESTIONS: Assume that you take a job with flexible hours, but initially your salary is based on a 40-
Answers to the Checkpoint questions can be found at the end of this chapter.
Each person will have a different wage where his or her supply of labor curve bends backward. Getting a large inheritance will generate substantial nonwage income and typically lead to fewer hours worked. Having a family will probably raise the income required before you will cut your hours.