DEMAND CURVE FOR A NETWORK GOOD
network demand curve A demand curve for a good or service that produces a network effect, causing it to slope upward at lower quantities before sloping downward once the market matures.
Because the value of network goods is influenced by external benefits, a demand curve for a network good does not look like a typical downward-
1 This model is discussed in greater detail in Nicholas Economides, “The Economics of Networks,” International Journal of Industrial Organization, 1996.
Demand for a Fixed Capacity Network Good
The model for a network demand curve makes two important assumptions. First, the model assumes that the short-
377
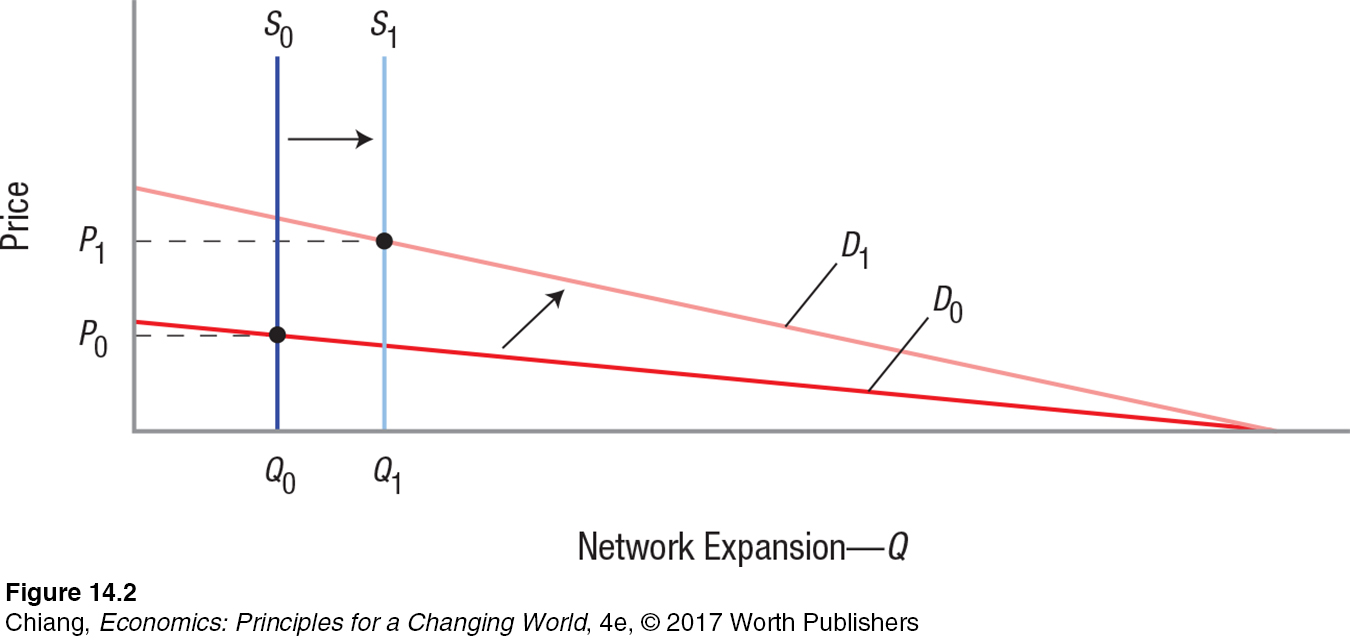
Figure 2 shows how a network market demand curve is developed. We start with a small network with a capacity of Q0, where demand is small and price (P0) is determined by the intersection of a vertical supply curve S0 at Q0 and demand D0 for that capacity. As the network expands (supply shifts to the right by an increment to S1), demand increases because the value to existing and new users increases. This is shown by the demand curve pivoting higher to D1 (while intersecting the horizontal axis at the same point as D0 to indicate a maximum demand for the network good) and reflecting a higher value to initial users and a higher market price at P1. This differs from a market for a non-
Deriving the Full Network Demand Curve
Network effects are strongest in the early stages of a network good’s development, as each additional consumer increases the marginal benefit to all consumers of the good. However, this network effect is always opposed by the law of demand. As price rises, quantity demanded falls. Which effect predominates?
When the quantity of a good provided on the market increases (without any change in demand), the price must fall in order for the market to clear. But the existence of network externalities causes demand to increase when a network expands, allowing prices to rise. Because the price effect and the network effect work in opposition to one another, the market price for a network good depends on which effect is stronger. For most network goods, the network effect dominates the price effect for small quantities, resulting in an upward-
core user A consumer who has a very high willingness to pay for a new product or service and is among the first to purchase it.
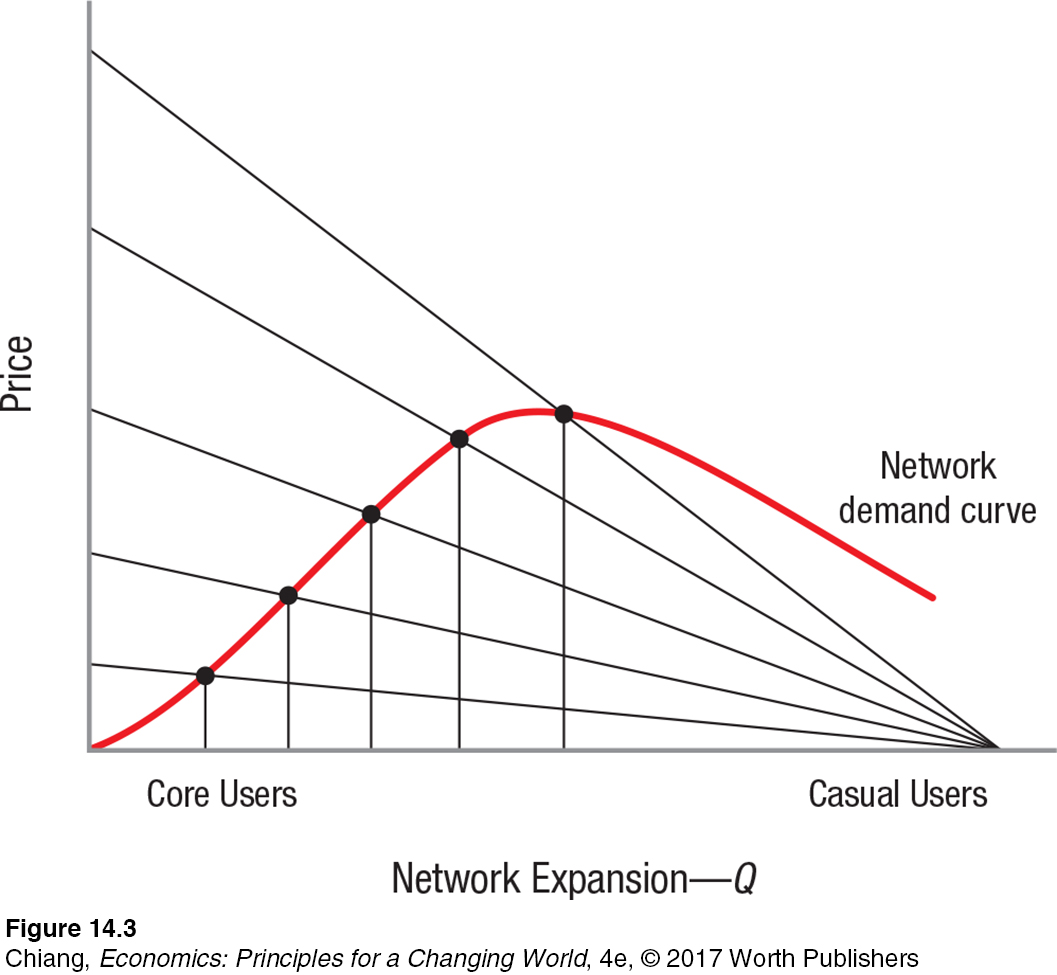
As the network expands along the upward-
casual user A consumer who purchases a good only after the good has matured in the market and is more sensitive to price.
As the market for a network good grows and reaches a critical number of consumers to support the network, additional consumers add fewer external benefits due to diminishing returns. These consumers who purchase the network good after it matures are called casual users (think of your grandmother buying the newest tablet only after everyone else in the family has one). Once a network good reaches this stage, the network demand curve slopes downward as the price effect (from the increase in supply due to lower production costs) dominates the network effect.
378
By connecting all of the intersections of supply and demand, a network demand curve is generated, which slopes upward from the origin as core users increase the value of the good and then slopes downward once the product matures and casual users buy the good.
Examples of Network Demand Curve Pricing in Our Daily Lives
What does the presence of a network demand curve mean for prices? It suggests that as a new network good is introduced, the price is kept low to attract new users. As the number of users increases, prices rise because people are willing to pay more for a network good used by more people. Prices continue to rise until the good matures, at which point prices must fall in order to sell a greater quantity.

Consider the following example: When Google launched in 1998, the search engine results displayed were quite bare—
Another example of network demand curve pricing is a new rock band attempting to gain recognition by initially playing for nothing at local clubs, and/or offering their music free online. Once the band becomes more well known, it begins charging for shows and for music downloads. Eventually, a downward-
379
CHECKPOINT
DEMAND CURVE FOR A NETWORK GOOD
The production of network goods is typically carried out in large increments due to high fixed capital costs.
The short-
run equilibrium for a network good occurs at the intersection of a fixed capacity vertical supply curve and the demand curve for that quantity. As a network expands, the effect of network externalities is reduced due to diminishing returns as the price effect becomes stronger.
A network demand curve is upward-
sloping for smaller quantities (when network effects are strong) and downward- sloping for larger quantities (when the network good matures and network effects weaken). A network demand curve reflects the role that core users (represented on the upward-
sloping portion of the curve) have in building the value of the network.
QUESTION: Why does a network demand curve slope upward for small quantities of a good, then slope downward for higher quantities?
Answers to the Checkpoint questions can be found at the end of this chapter.
A network demand curve gains value based on the number of people who use it. For example, a network good with one consumer is virtually worthless. As more consumers buy the network good, its value rises and the network good becomes attractive to even more consumers. Once a good matures, the network effect weakens and additional consumers will buy the good only after the price drops. Hence, the demand curve slopes downward for higher quantities of the good.