MARKET EQUILIBRIUM FOR A NETWORK GOOD
Now that we have learned how a network demand curve is developed, we can study how market equilibrium is reached in this type of industry. The market equilibrium for a network good occurs once most network effects are realized. Therefore, equilibrium generally is found on the downward-
Economies of Scale and Marginal Cost
An important characteristic of network goods is that they generally require a very large fixed cost to produce. Fixed costs can include the cost of writing and producing a new hit song, or the huge cost of building cell-
Finding an Equilibrium in the Market for Network Goods
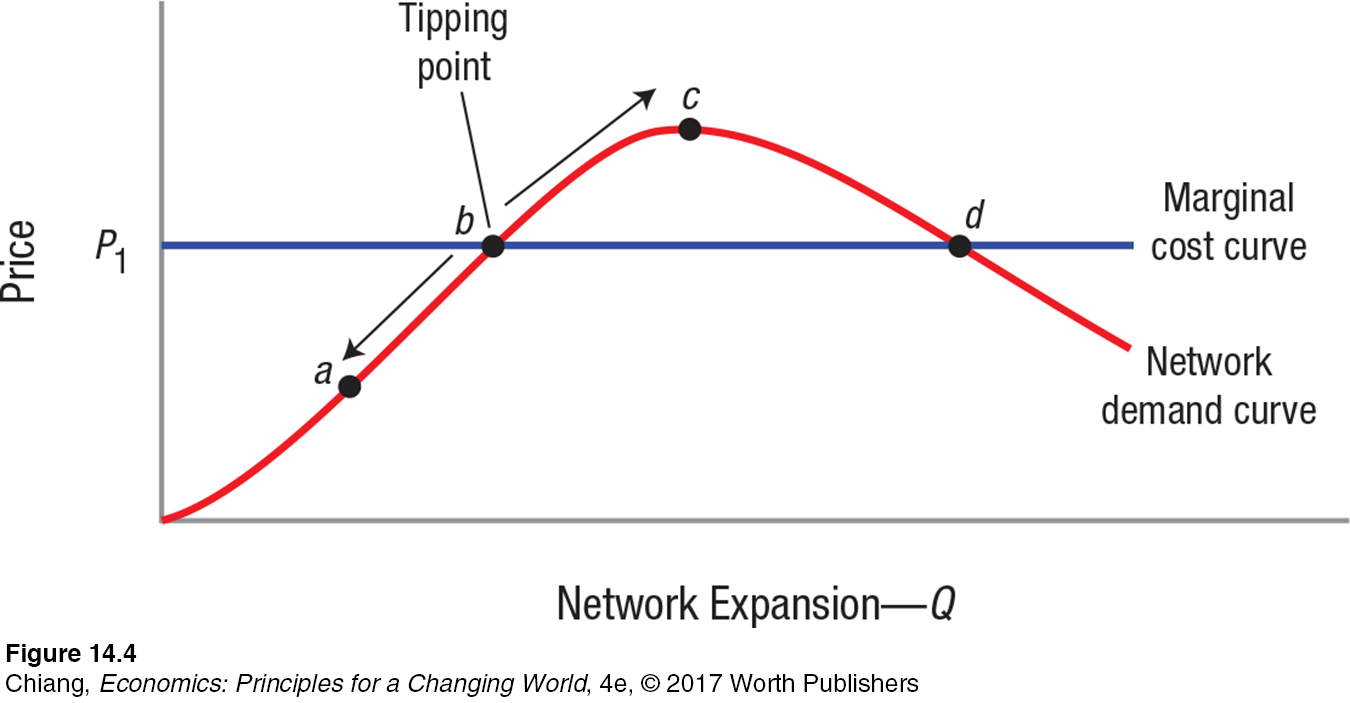
tipping point (or critical mass) The quantity from which network effects are strong enough to support the network.
Let’s assume that the marginal cost of a network good is fixed at P1, as shown in Figure 4. The equilibrium is point d, the intersection of the downward-

virtuous cycle The point at which a network good reaches its tipping point, when network effects cause demand for the good to increase on its own. As more people buy or subscribe to a good or service, it generates even more external benefits and more demand.
vicious cycle When a network good does not reach its tipping point, and therefore does not increase in value enough to retain its customers, customers leave the network, thereby further diminishing the value of the good until all customers leave the network.
Once a network reaches point b, the existence of network effects will continue to generate more demand, allowing the network to expand on its own until it reaches equilibrium at point d. This is referred to as a virtuous cycle, in which network effects push demand farther to the right, creating even more value for the network.
380
However, if a network good fails to reach point b, or if a new competing network good causes demand to move to a point left of point b, a vicious cycle can result. In a vicious cycle, people stop consuming a product or service, thereby reducing the value of the product to others, which causes even more people to avoid consuming the good. The result is typically a failed product, shown as a good at point a in Figure 4.

An example of a product entering a vicious cycle was the HD DVD format introduced by Toshiba in 2006. Toshiba competed vigorously for market share against Sony’s Blu-
Note how the network demand curve slopes upward to point c, then downward. What explains this change in slope? Point c represents the point of product maturity, when the network effect no longer dominates the price effect. Remember that a demand curve slopes downward due to a price effect—
Network Goods Can Face a Virtuous Cycle or a Vicious Cycle Very Quickly
The speed at which network effects can influence the success or failure of a product or service can be remarkably fast. As shown in Figure 4, once a firm enters a vicious cycle by moving down the network demand curve to the left of point b, it is often difficult to stop the cycle. Meanwhile, firms entering virtuous cycles enjoy what seems to be limitless growth over a very short period.
Table 1 provides examples of network goods that experienced a change in market leader at some point over the last two decades. In some cases the change was gradual (such as the transition from film to digital, because ardent film photographers took many years to make the switch to digital), whereas in other cases the change was almost instantaneous (such as when the HP Mini netbook was quickly made obsolete by the Apple iPad).
| TABLE 1 | EXAMPLES OF NETWORK GOODS FACING VIRTUOUS AND VICIOUS CYCLES | |
| Industry | Previous Market Leaders | Current Market Leader |
| Social networking | Friendster (2002– |
Facebook (2009– |
| Myspace (2005– |
||
| Internet search engines | AltaVista (1997– |
Google (2001– |
| Word processing software | WordPerfect (1980– |
Microsoft Word (1997– |
| Video game consoles | PlayStation 1 and 2 (1995– |
Sony PS4 (2014– |
| Nintendo Wii (2008– |
||
| Microsoft Xbox 360 (2012– |
||
| Internet browsers | Netscape (1995– |
Google Chrome (2012– |
| Internet Explorer (1999– |
||
| Mozilla Firefox (2009– |
||
| Internet service providers | Prodigy (1991– |
Comcast Xfinity (2013– |
| America Online (1995– |
||
| AT&T DSL (2004– |
||
| Photography | Kodak (film) (1936– |
Canon (digital) (2005– |
| Smartphones | Blackberry (2003– |
Apple iPhone (2011– |
| Tablets/netbooks | HP Mini (2008– |
Apple iPad (2010– |
Interestingly, the quality of a network good is not always the most important factor in determining the market leader in a network industry. Because network effects are so powerful, consumers sometimes choose an inferior product that many people use over a superior product that fewer people use. For example, some video game enthusiasts claimed that Sony’s PlayStation 3 was superior in graphics and capabilities to Nintendo’s Wii. Yet, the Wii system held its position as market leader for four years, partly due to its lower price but also due to a virtuous cycle it had enjoyed until Microsoft’s Xbox 360 took over as the market leader in 2012, and then subsequently by Sony’s improved PS4 system in 2014.
381
ISSUE
The Broadband Effect: Virtuous and Vicious Cycles in Network Goods
Most Americans rely on broadband Internet connections for work, school, or entertainment. Over 73% of U.S. households in 2016 had a broadband connection, up from just 11% in 2002. Part of this dramatic rise in broadband connectivity has been the result of government efforts to promote broadband usage in all areas of the country, especially in rural areas where it is costly to establish broadband connections.

In 2015, the U.S. Federal Communications Commission (FCC) implemented the second phase of its Connect America Fund to promote the goal of ensuring that every household has access to broadband capability. This fund consists of fees collected from all broadband users nationwide and is used to subsidize service in high-
No doubt, the nearly universal use of broadband has resulted in significant changes to network industries. For example, network services such as movie and live television streaming, online conferencing, worldwide telecommunications via Skype and other online providers, and instant music and software downloads were all either previously unavailable or excruciatingly time-
But not all industries fared well with the rise in broadband usage. Some markets faced a vicious cycle as consumers moved away from certain network goods. These include traditional international calling, calling cards, and prepaid phones. Beyond telecommunications, broadband also contributed to the demise of most physical DVD and game rental stores, CD music stores, and software stores, as all of these services can now be obtained online.
Like all industries, goods come and go, and network goods are no different. What is remarkable is how quickly this transformation took place over the last decade. How today’s network goods fare in the future will be an interesting question to examine as technological improvements continue to change the way we live.
382
Because of the speed at which market demand for network goods can occur, no firm is ever “safe” with its market share. Aware of this, businesses often engage in various competitive strategies to increase or secure their market shares. The next section describes some of these strategies.
CHECKPOINT
MARKET EQUILIBRIUM FOR A NETWORK GOOD
Network goods generally exhibit large economies of scale due to their high fixed costs and low marginal costs of production.
A network good must reach its tipping point (or critical mass) to enter a virtuous cycle in which network effects generate additional demand until equilibrium is reached.
Network goods that do not reach their tipping point enter into a vicious cycle, leading to a sharp decline in market share and likely failure of the good.
Network goods can enter virtuous or vicious cycles in a very short period, such that no good is ever safe from rapid decline.
QUESTION: Mobile apps are a multibillion dollar industry that is constantly changing. Today, over 1 million apps are available for smartphone users to download, though the vast majority of these apps never become popular. Even apps that do become popular can be quickly replaced by new apps just months after reaching their peak number of downloads. Gaming apps have the shortest average lifespan among all categories of apps. How does the network demand curve explain the speed by which gaming apps rise in popularity and then fall to obscurity?
Answers to the Checkpoint questions can be found at the end of this chapter.
Most apps depend on a network effect for their existence. As more people use an app, a virtuous cycle may result as word-