POVERTY
408
Thus far, we have examined income distribution in general terms, looking at the spectrum from the top to the bottom. This section focuses on the bottom of the income spectrum—
How difficult is life in poverty? A household of four in the United States that lived on less than $24,259 in the year 2015 was considered in poverty. That is equivalent to one wage earner working full-
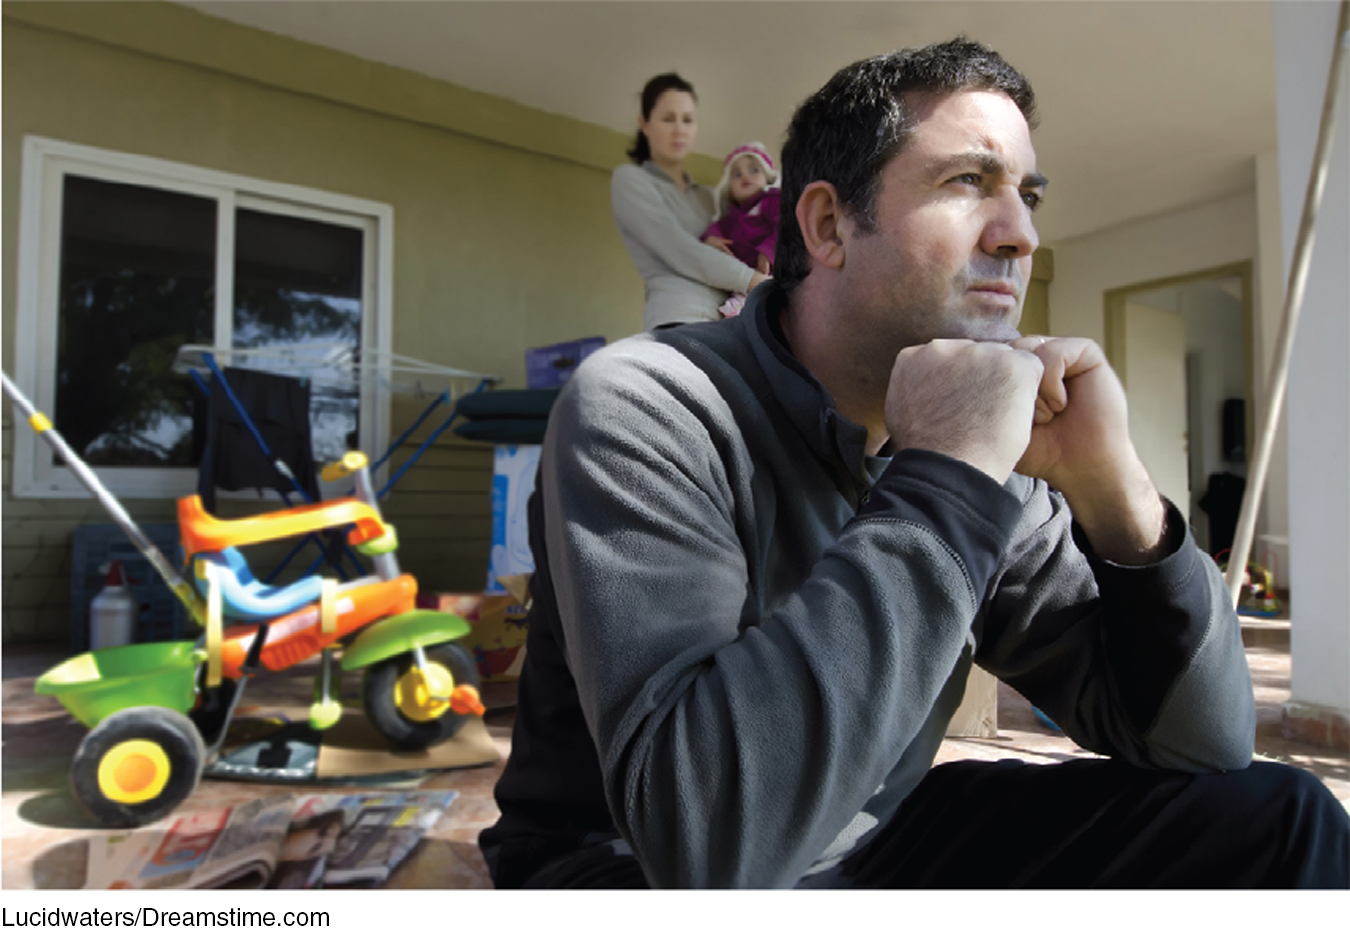
A household of four living on $2,000 per month can expect to have $1,750 after payroll and other taxes are deducted. Subtracting the rent on a modest subsidized apartment or a public housing apartment of $700 per month, $250 per month in utilities (electricity, gas, water, trash pickup, telephone, and basic Internet and cable), $250 per month toward a car payment, and $150 per month for fuel and auto insurance, this household has $400 left, or about $100 per week for everything else: food, clothing, school expenses, health insurance, child care, and entertainment. Not to mention the occasional car repair, doctor and dentist co-
Living in poverty means that tough choices must be made to make ends meet. Some choose to give up their car and instead rely on public transportation. Others give up cable or the landline telephone. In more severe cases, some households are forced to cut back on food or health care. These choices are faced by 1 out of 7 persons in the United States. Why does the world’s richest nation have so many poor citizens? Let’s start to answer this by looking at how poverty is measured.
Measuring Poverty
poverty thresholds Income levels for various household sizes, below which people are considered to be living in poverty.
Poverty thresholds were developed by Mollie Orshansky in the 1960s. They were based on the Department of Agriculture’s Economy Food Plan, the least expensive plan by which a family could feed itself. The Department of Agriculture first surveyed the food-
1 See Constance F. Citro and Robert T. Michael, Measuring Poverty: A New Approach (Washington, D.C.: National Academy Press), 1995, p. 13 and Chapter 2, for more detail on how thresholds are measured.
Poverty thresholds are updated each year to account for inflation using the consumer price index (CPI). Table 6 shows the poverty thresholds for 2015. If a household earns less than the threshold, every person in that household is considered poor. Poverty thresholds do not vary geographically. Also, “income” includes income before taxes, including cash benefits, but not capital gains or noncash benefits such as food stamps, public housing, or Medicaid benefits. Poverty thresholds are updated by the Census Bureau and are used primarily for statistical purposes.
| TABLE 6 | U.S. POVERTY THRESHOLDS, 2015 |
| One person | $12,085 |
| Two people | 15,397 |
| Three people | 18,872 |
| Four people | 24,259 |
| Five people | 28,729 |
| Six people | 32,512 |
| Seven people | 36,971 |
| Eight people | 41,017 |
| Nine people | 49,079 |
Information from U.S. Census Bureau.
In practice, to qualify for certain federal programs, a slightly modified measure called the poverty guidelines is used. These guidelines are issued by the Department of Health and Human Services, and are very similar to the poverty thresholds from the Census Bureau. The exception is that there are separate poverty guidelines for Alaska and Hawaii due to the higher cost of living in these states. For the purposes of our analysis, we will use the poverty thresholds from the Census Bureau.
409
The Incidence of Poverty
poverty rate The percentage of the population living in poverty.
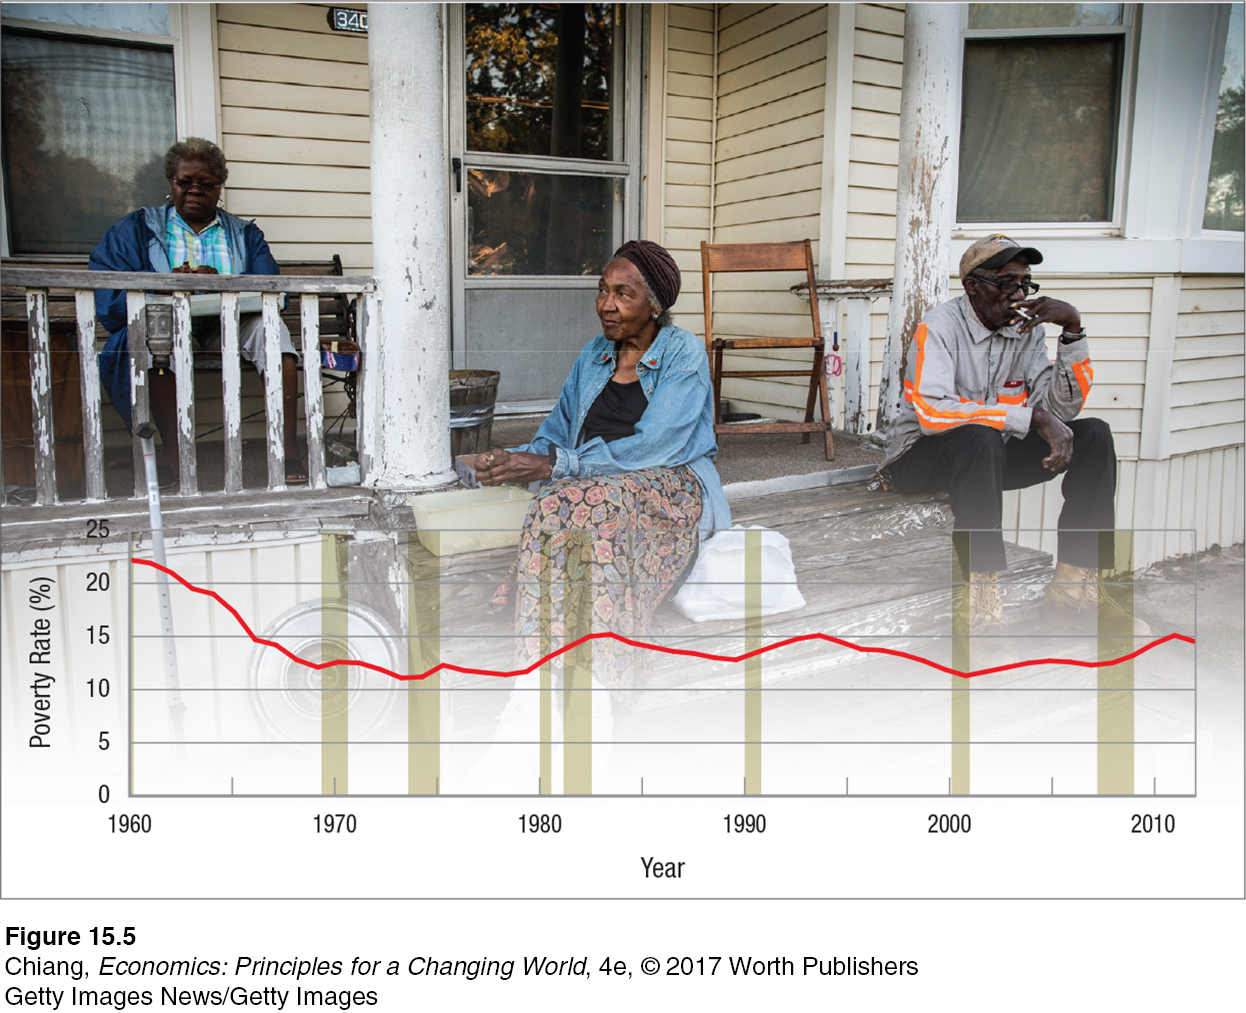
The poverty rate is the percentage of the population living in poverty. Poverty rates for the United States since 1960 are shown in Figure 5. Poverty fell rapidly between 1960 and 1975, but has remained roughly stable ever since, fluctuating with the business cycle: rising around recessions (the shaded vertical bars) and falling when times are good.
410
Poverty rates vary considerably along racial and ethnic lines. Figure 6 charts the poverty rate since 1970. Over most of this time, the poverty rate for blacks and Hispanics was roughly twice the rate for whites. Both of these minority groups benefited, however, from the strong economic growth of the 1990s and early 2000s, their poverty rates dropping from around 30% to around 25% today. White poverty remained fairly steady over the 1990s, fluctuating between 10% and 11%. However, the recession in 2007–
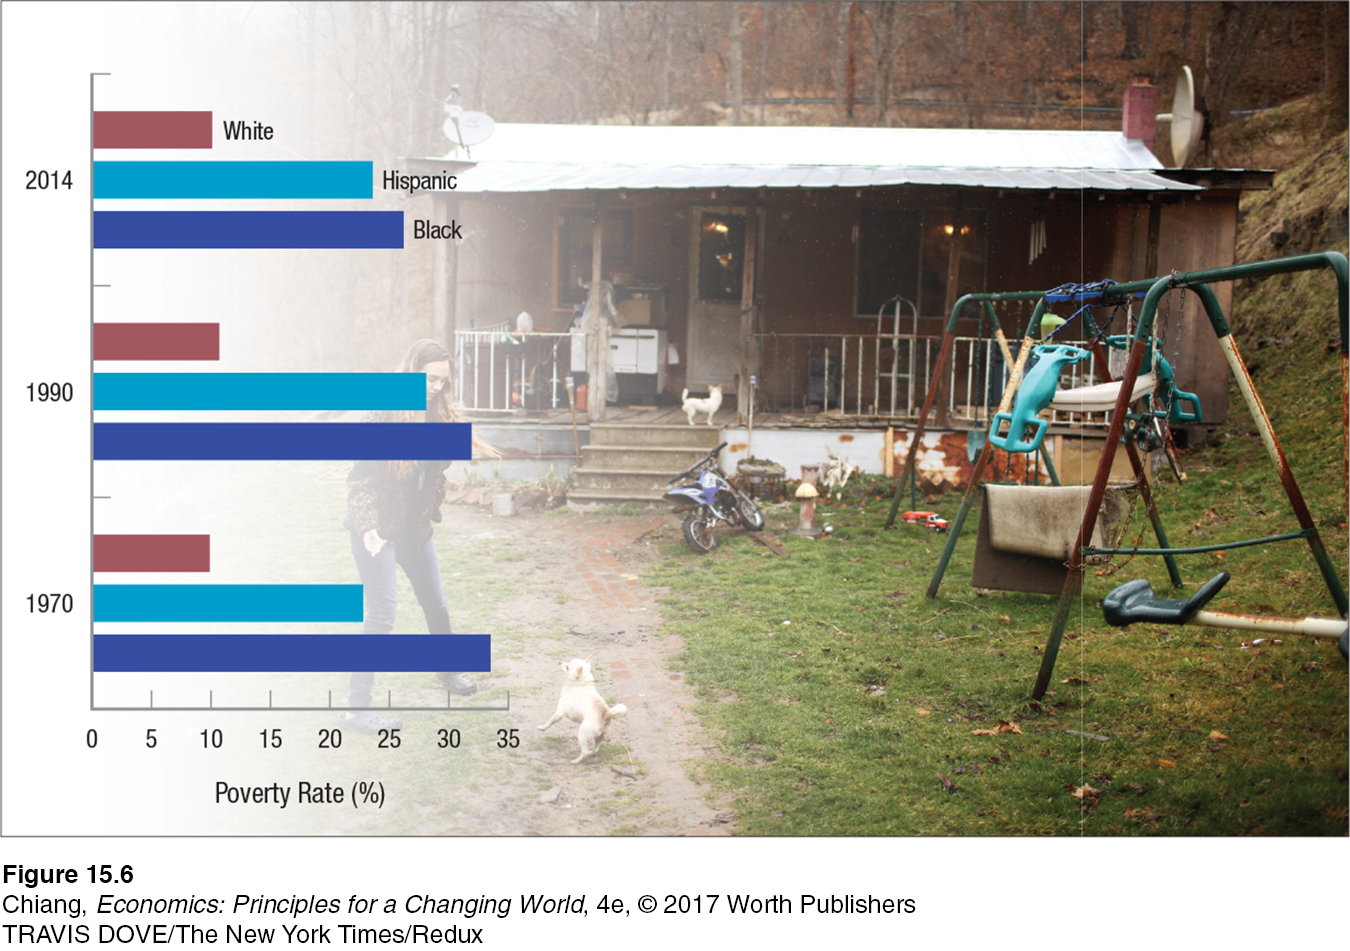
These data suggest that robust economic growth is a major force for reducing poverty. The expression “a rising tide floats all boats” would appear to have something to it.
Table 7 shows other characteristics that contribute to poverty. Single parent households have 2 to 5 times the poverty rate of married couples. Not surprisingly, working part-
| TABLE 7 | PEOPLE AND FAMILIES IN POVERTY BY SELECTED CHARACTERISTICS, 2014 |
| Characteristic | Poverty Rate |
| Type of Household | |
| Married- |
6.2% |
| Female households (no husband) | 30.6 |
| Male households (no wife) | 15.7 |
| Work Experience | |
| Worked full- |
3.0 |
| Worked part- |
15.9 |
| Did not work | 33.7 |
| Race | |
| White | 10.1 |
| Black | 26.2 |
| Asian | 12.0 |
| Hispanic | 23.6 |
Data from U.S. Census Bureau, Current Population Reports, P60-
Depth of Poverty
It is one thing to say that a certain percentage of the population is poor. It is another to determine just how poor they are. The poverty threshold for a family of four today is a little over $24,000. If most poor families have incomes approaching this threshold, we could be confident that poverty was just a transitory stage—
411
But if, conversely, many poor families have incomes below $10,000, our view of poverty would be different, and our public policies aimed at reducing poverty would need to be considerably more robust.
income deficit The difference between the poverty threshold and a family’s income.
To gain a view of the broad spectrum of poverty, economists have developed two depth of poverty measures that describe the economic well-
ratio of income to poverty The ratio of family income to the poverty threshold. Families with ratios below 0.5 are considered severely poor, families with ratios between 0.5 and 1.0 are considered poor, and those families with ratios between 1.0 and 1.25 are considered near poor.
The second measure of poverty, the one we will focus on, is the ratio of income to poverty. It compares family income to the poverty threshold and expresses this comparison as a ratio. Thus, the ratio for families with incomes equal to the poverty threshold equals 1.0; the ratio for those living at half the threshold income is 0.5. The Census Bureau considers people who live in families with ratios below 0.5 to be “severely or desperately poor.” Those with ratios between 0.5 and 1.0 are “poor,” and people with ratios above 1.0 but less than 1.25 (less than 25% above the poverty threshold) are considered to be “near poor.”
Of the 47 million poor people in 2014, over 20 million of them were desperately poor, and an additional 15 million were categorized as near poor. These measures (income deficit and the ratio of income to poverty) provide us with a more nuanced picture of poverty.
Alternative Measures of Poverty Many researchers have questioned the relevance of the current method for determining poverty thresholds. The National Academy of Sciences studied the official approach to poverty thresholds and concluded that the measure is flawed because “[it]counts taxes as income, [and] is flawed in the adjustments to the thresholds for different family circumstances.”2
2 Citro and Michael, Measuring Poverty, pp. 97–
412
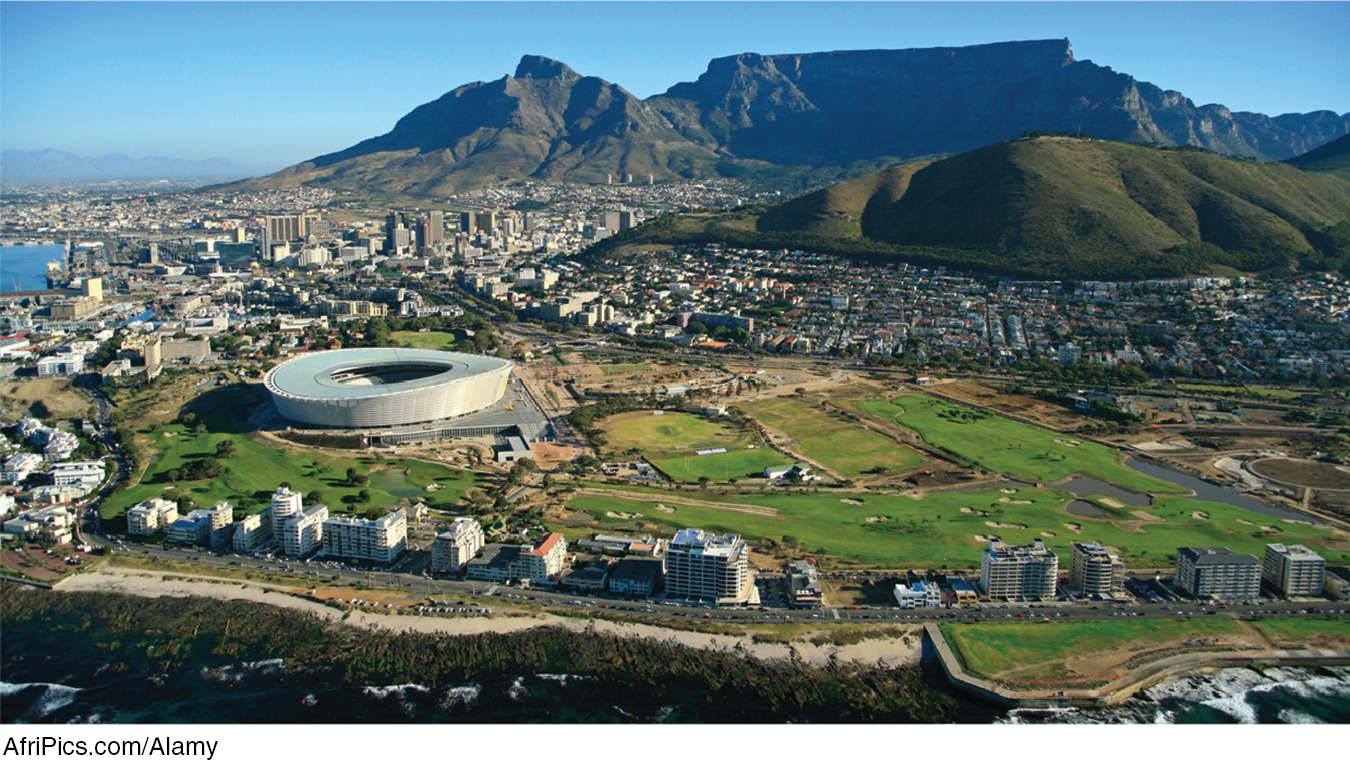
South Africa: A Nation of Rich Treasures and Income Inequality
How is South Africa, one of the richest countries in Africa, trying to reduce income inequality and poverty?
South Africa is known for its many beautiful beaches and wildlife parks, which attract tourists from around the world desiring to venture on a safari or other adventures without sacrificing the modern conveniences that many other African countries lack. And although the average income in South Africa is among the highest in Africa, this statistic does not tell the entire story of the typical life of South Africans, of whom nearly half live in poverty.
How severe is income inequality in one of the wealthiest countries in Africa?
A common measure of income inequality is the Gini coefficient, in which higher values represent greater income inequality. According to the World Bank, South Africa has one of the highest Gini coefficients in the world at 0.63. In comparison, the Gini coefficient in the United States is 0.48, while in Norway, which has one of the lowest Gini coefficients in the world, it is 0.25. South Africa’s income inequality can be seen most dramatically in the major cities of Cape Town and Johannesburg, where glittering condos and luxury shops are found not too far from decrepit homes and neighborhoods that one would expect to see in an impoverished country.
Part of the problem can be traced to its history, in which the well-
Efforts to reduce income inequality and poverty have centered on government efforts to attract foreign investment and promote small businesses that help drive economic activity, especially in the poorest parts of the country. Moreover, since the end of apartheid, the government has pumped significant amounts of money to build infrastructure such as modern utilities and new schools in places like Soweto, a historically poor township near Johannesburg that today is buzzing with trendy new shops and restaurants. The home of Soweto’s most famous former resident, the late Nelson Mandela, is now a museum attracting thousands of tourists whose spending further boosts the local economy.
Although the problems of poverty and income inequality still persist in South Africa, increased foreign investment and a more favorable economic environment have resulted in a fast-
GO TO  TO PRACTICE THE ECONOMIC CONCEPTS IN THIS STORY
The main argument that the study puts forth is that poverty thresholds should not be “one-
Given the Academy’s findings, the Census Bureau developed some new ways of measuring poverty. These alternative measures of poverty differ from the old in basing their estimates on after-
413
The Census Bureau derived its new estimates of income thresholds from a survey of expenditures on food, clothing, housing, utilities, and other necessities for the typical family of four (two adults and two kids). These figures were then adjusted to reflect differences in family composition and size, given that children consume less than adults, some household economies are associated with larger families, and the first child in a one-
Causes of Poverty
The reasons why poverty persists are wide-
As economic and social change took place in recent decades, new factors have contributed to the rise in poverty. First, wages generally have not kept up with rising costs; specifically, a single parent working at the minimum wage cannot escape poverty today, whereas 40 years ago it was possible. Second, technological changes and globalization have changed employment opportunities and led to unemployment in certain industries that forced people into poverty. Third, rising health costs have led some to give up work to care for an ill family member, forgoing earnings. And finally, changes in family structure, particularly an increase in single parenthood, have made it more difficult to avoid a life of poverty. These reasons and others have encouraged policymakers to rethink approaches to eliminating poverty.
Eliminating Poverty
Poverty can be a relative or an absolute measure. As we saw earlier, the official measure of poverty in the United States is based on an absolute number, the poverty threshold. Some researchers, however, think a relative measure would be more useful, such as labeling the bottom 20% of American households as “poor.”
If we decide to use such a measure, poverty will never be eliminated, no matter how wealthy our country might become. A relative measure obscures the fact that poverty in the United States means something different than it does in the developing world. In the United States, being poor might mean scraping by paycheck to paycheck and having to give up such things as cable television or eating out. In some developing countries, being poor might mean literally starving.
The official U.S. poverty threshold for an individual is an income of roughly $32 a day. In the developing world, by contrast, the World Bank and other agencies define poverty as incomes of less than $2 a day. By World Bank standards, poverty has already been eradicated in the United States.
Reducing Income Inequality Regardless of how poverty is defined, the question of how to reduce it remains controversial. The political left views income and wealth redistribution as the chief means to reduce poverty. Social justice, they argue, requires that the government provide an extensive safety net for the poor. In their view, services that the government already provides, including public education, housing subsidies, Medicaid, and unemployment compensation, should be greatly expanded.
Moreover, they claim these policies should be supplemented by increasing the progressivity of the tax system. This would reduce the inequalities in wealth and income. By increasing the tax burden on the well-
414
ISSUE
What Is Considered “Poor” Around the World?
Every country uses its own definition of what constitutes being poor. In the United States, the official poverty threshold is calculated as an absolute measure. This means a family of four making $24,259 or less in the year 2015 was considered poor. However, a family of four making $24,259 a year in China or India would be considered quite wealthy in their countries. Compared to many developing countries, being poor in America still allows for a relatively comfortable life.
Many countries in the European Union, however, use a relative measure of poverty. In Denmark, a family is considered poor if it earns less than 60% of the median income. With the median household income being over $75,000 a year, this means a family earning less than $45,000 a year is considered poor. In addition, Denmark offers full health care coverage to every citizen and free college tuition. Certainly, an American family earning $45,000 a year and receiving free health care and college education for its children would not be considered poor.
The main culprits for the difficulty in defining and comparing poverty rates between countries involve differences in the cost of living, the role of government, and overall economic development. In rich countries, the cost of living is higher, governments often provide more services, and citizens have a higher expectation of what is considered necessary for survival. In poor countries, the cost of living is low, governments often cannot provide much assistance, and citizens are merely surviving.
To provide a better comparison of poverty across the world, various organizations have devised methods to compare living standards and poverty rates across countries. The United Nations publishes the Human Development Index each year, which provides an overall picture of a country’s living standard based on factors such as access to education, running water and sanitation, health care, and communications. However, it does not provide a percentage of the country being poor. The World Bank uses an absolute measure with thresholds ranging from $1.25 a day (extreme poverty) to $2 a day, adjusted to the cost of living, to estimate the number of poor in mostly developing countries. Finally, the Organisation for Economic Co-
The availability of these statistics allows us to compare poverty rates around the world better. Still, difficulties remain when cultural differences influence what is considered vital for survival in each country.
Increasing Economic Growth The opposite side of the political spectrum argues that such programs, when allowed to become too expansive, can be disastrous. Welfare significantly reduces the incentive to work and produce, thereby reducing the economy’s output. A vibrant market economy accommodates the wishes of those who want full-
Because wages provide nearly 70% of all income, those on the political right note that there inevitably will be some inequality in a market system. Some people, after all, make bad choices and fail to invest enough in their education or job skills. Yet, the possibility of failure itself provides an incentive to work hard and invest, and the political right sees this sort of efficiency in the economy as being more important than equity or fairness. The best way to cure poverty, they argue, is by implementing policies that increase the economic pie shared by all, not just by splitting up the pie more evenly.
415
This political dispute has fueled a controversy in economics. One group of economists argues that economic growth raises low incomes at a rate similar to that of average incomes, such that the poor benefit from growth just as much as anyone else. Other economists reply that the shift toward freer markets around the world, combined with the resulting economic growth, has widened inequalities, causing the poor to fall further behind.
Who is right? Jagdish Bhagwati, a well-
in economic terms, growth [is] an instrument, not a target—
He adds a caveat, however, that
the political sustainability of the growth-
3 Jagdish Bhagwati, “Does Redistributing Income Reduce Poverty?” Project Syndicate, October 27, 2011.
In sum, Bhagwati states that economic growth raises all incomes in absolute terms, including the poor, which reduces poverty. However, relative incomes may continue to suffer, as income inequality can widen with economic growth.
Rawls and Nozick Unfortunately, there is no unified theory of income distribution that takes the various issues we have discussed into account. Earlier chapters suggested that income depends on productivity—
Human capital analysis adds that as people invest in themselves, their productivity and income rise. Analysis of imperfect input markets, however, shows that income distribution advantages accrue more to those with market power.
Our analysis of economic discrimination suggested several more reasons why incomes may be skewed in favor of some groups rather than others. The bargaining strength of labor unions is yet another factor that can skew income distribution, in this case in favor of union members.
These analyses have focused, in one way or another, on whether certain patterns of income distribution are economically efficient. Yet, how do we know whether various income distributions are equitable or fair? Is there anywhere to turn for theoretical help in addressing this question? The answer is a qualified “yes.” Two philosophers, John Rawls and Robert Nozick, published competing views on this subject in the early 1970s.4
4 John Rawls, A Theory of Justice (Oxford: Clarendon), 1972; Robert Nozick, Anarchy, State and Utopia (Oxford: Blackwell), 1974.
John Rawls proposed the “maximin principle,” in which he argued that society should maximize the welfare of the least well-
Robert Nozick argued that it is “illegitimate to use the coercive power of the state to make some better off at the expense of others.” To Nozick, justice requires protecting property rights “legitimately acquired or legitimately transferred.”5 Using Nozick’s argument, gaming app developers who succeeded in creating fun and highly addictive games such as Candy Crush Saga and Angry Birds and subsequently became very wealthy because millions willingly bought premium game subscriptions, cannot be considered unjust. Instead, Nozick would argue it would be unjust if the creators were not rewarded for their innovation that has provided countless hours of fun for so many people.
5 John Kay, The Truth about Markets: Their Genius, Their Limits, Their Follies (London: Penguin Books), 2003, p. 187.
416
This debate highlights the perennial tradeoff in economic policy between equity and efficiency, a tradeoff that serves as a bone of contention in nearly every discussion of economic and public policy. Although microeconomics is sometimes beset by controversy, at its best it provides us with a dispassionate framework for analyzing and discussing many issues.
Mobility: Are Poor Families Poor Forever? The poverty rates and income distribution data provide a snapshot in time. How about over time? What is the human side to this? Do people start in poverty or fall into poverty and then stay there, or is there movement out of poverty?
A study by the U.S. Census Bureau tracking over 42,000 American households from 2009 to 2011 provides an answer. The study found that of the households that were living in poverty at the start of 2009, 35% were no longer living in poverty by the end of 2011.6 Of these households, about half were living just above the poverty line, while the other half did much better and were earning incomes well above the poverty line. The results indicate that mobility between income groups is possible, and that not all who are in poverty stay there forever.
6 U.S. Census Bureau, Current Population Reports, P70-
However, additional data from the Census Bureau tell the other side of the story. Although millions of households pull themselves out of poverty each year, millions more find themselves falling into poverty. During the last economic recession and the slow economic recovery that followed, millions of households fell into poverty for the first time, causing the poverty rate to rise above 15% in 2010. The fortunate news is that many of these households will remain in poverty only temporarily as new jobs are created with continued economic growth.
The movements of households in and out of poverty mirror the findings of the University of Michigan’s Panel Study of Income Dynamics, which has followed 18,000 individuals since 1968. It shows how fluid the income distribution really is. Data from this study show that within a 10-
Chris Tilly, director of UCLA’s Institute for Research on Labor and Employment, states that “poverty is dynamic; not everybody stays in poverty long term. We’ve always known that people move in and out of poverty, [but] there are people who tend to get stuck.”7 Households that remain in poverty over time, although a relatively small percentage of the population, are the most worrisome. Research by Richard B. Freeman of Harvard tells us that there is a core of poor people who stay poor. This core has physical disabilities, suffers from substance abuse, or is unable to work for a host of other reasons.
7 Ari Bloomekatz, “Poverty Often a Temporary State, U.S. Census Study Finds,” The Los Angeles Times, March 28, 2011.
These findings suggest that poverty will never be totally eradicated. They also suggest that policies to deal with core poverty should be different from policies that deal with people who start or who have fallen into poverty but are highly likely to escape.
417
CHECKPOINT
POVERTY
Poverty thresholds were developed in the 1960s based on a food budget, adjusted for family size, then multiplied by 3.
Economic growth has been a major force in reducing poverty in the United States.
The income deficit measures how far below the poverty threshold a family’s income lies.
The other depth of poverty measure is the ratio of income to poverty. If the ratio is below 0.5, the family is considered “severely or desperately poor.” A ratio greater than 1.0 but less than 1.25 indicates the family is “near poor.”
The Census Bureau has introduced new measures of poverty that consider health care costs, transportation needs, and child care costs.
The controversy surrounding reducing poverty focuses on whether reducing income inequality or increasing economic growth is the best approach.
Philosopher John Rawls proposed a “maximin principle” that suggests society should maximize the welfare of the least well-
off individual. Robert Nozick argued that the state should not use its coercive power to make some people better off at the expense of others.
Income mobility is quite robust in the United States, with more than half of all families moving up and down the income distribution ladder in any decade.
QUESTION: Suppose that the United States adopts a relative measure of poverty based on a threshold determined by 60% of the median household income. If the median household income for a family of four is $55,000, how would this new measure affect the poverty rate using the existing absolute thresholds?
Answers to the Checkpoint questions can be found at the end of this chapter.
If a relative measure is used to measure poverty, those earning less than 60% of the median household income of $55,000, or 0.60 × $55,000 = $33,000, would be considered living in poverty. This amount is higher than the current absolute threshold of about $24,000, which means the poverty rate would rise under this new measure.