chapter summary
48
chapter summary
Section 1 Basic Economic Questions and Production
2.1 Every economy must decide:
What to produce.
How to produce it.
Who will get the goods produced.
Using scarce resources productively leads to:
Production efficiency: Goods and services are produced at their lowest possible resource cost.
Allocative efficiency: Goods are produced according to what society desires.
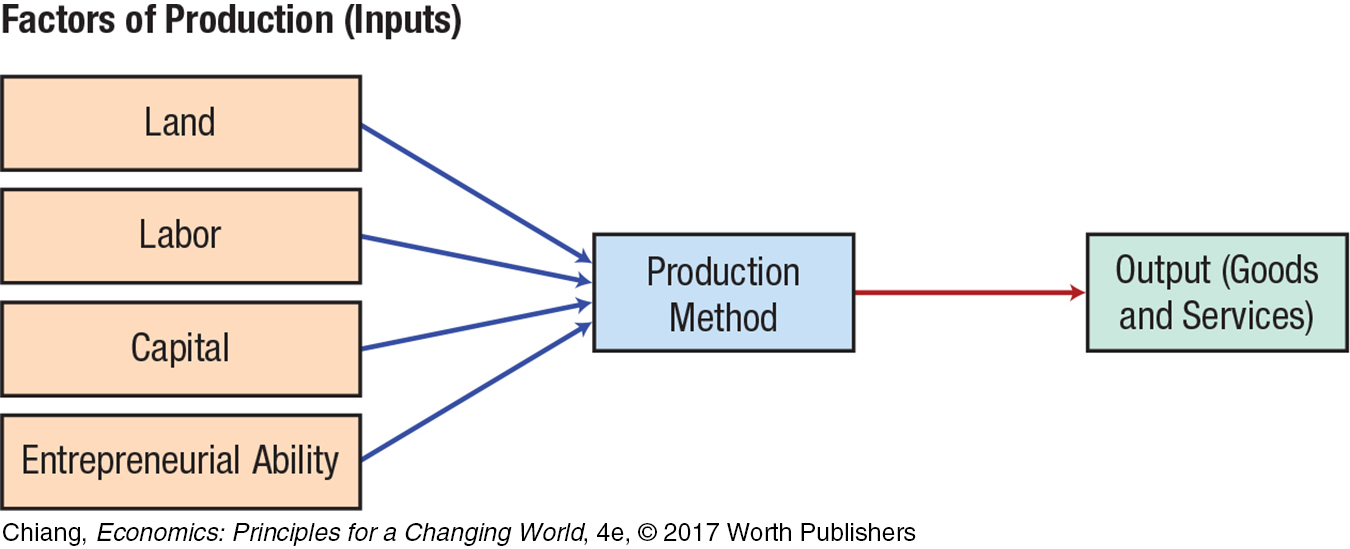
2.2 Factors of Production (Inputs)
Section 2
Production Possibilities and Economic Growth
2.3 The production possibilities frontier (PPF) shows the different combinations of goods that a fully employed economy can produce, given its available resources and current technology.
2.4 Production possibilities frontiers (PPFs) illustrate tradeoffs—
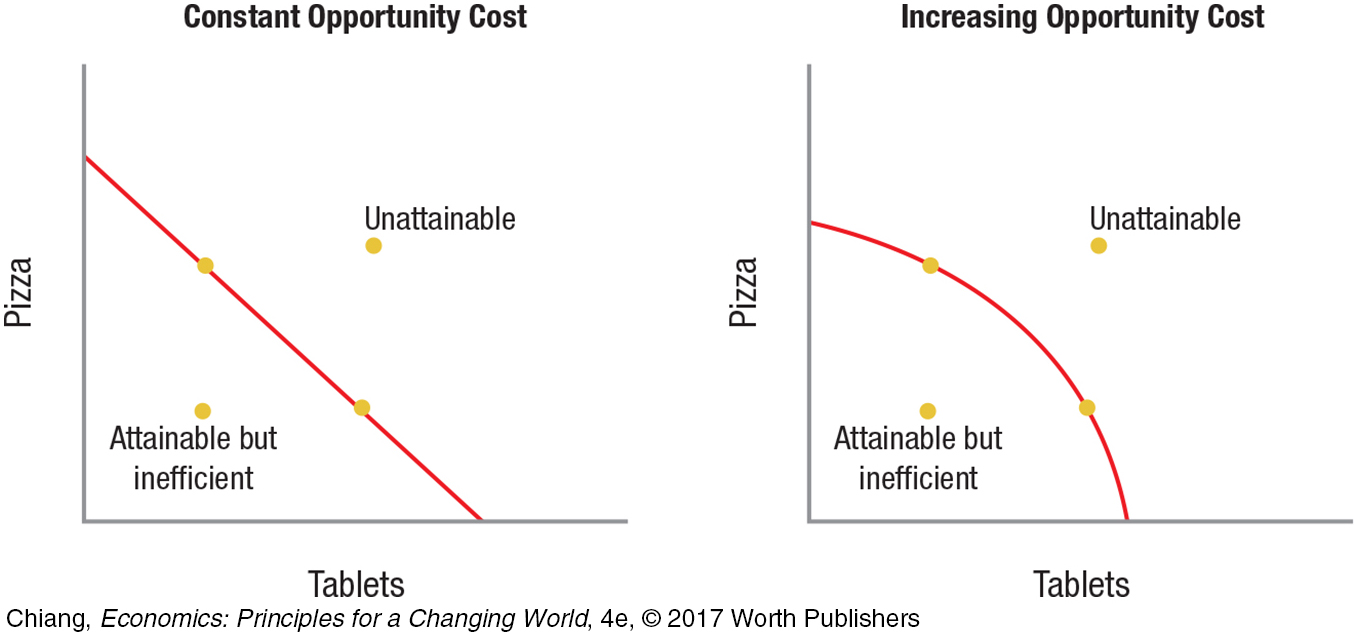
49

Some pizza makers were never meant to produce computers and some computer workers were never meant to produce pizza, which increases the opportunity cost of production as more of one good is produced.

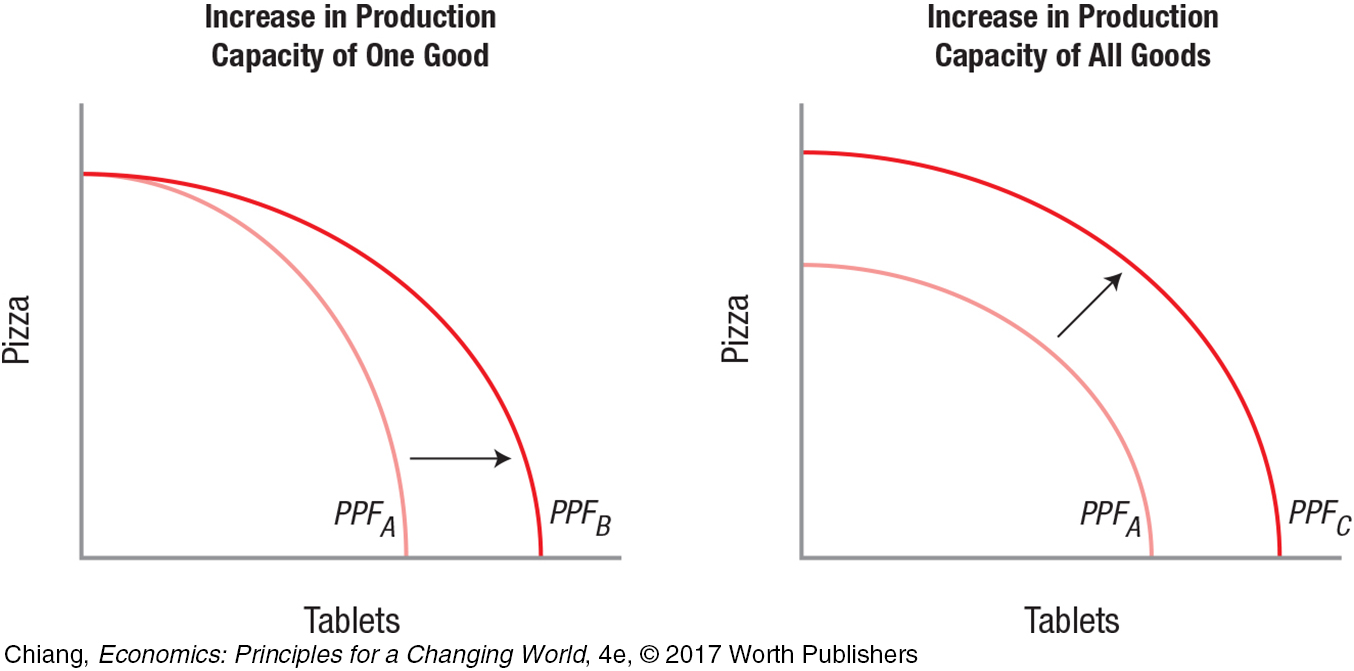
The production possibilities model shows how economic growth can arise from an expansion in resources or from improvements in technology, or both.
2.5 Changes in the PPF: From PPFA to PPFB: An increase in productivity in the production of one good (e.g., an increase in the number of students studying computer engineering).
From PPFA to PPFC: An increase in productive capacity of both goods (e.g., an increase in overall technology, or an increase in labor or capital resources).
Section 3
Specialization, Comparative Advantage, and Trade
2.6 An absolute advantage exists when one country can produce more of some good than another.
A comparative advantage exists when one country can produce a good at a lower opportunity cost than another.
Gains from trade result when a country specializes in the production of goods in which it has a comparative advantage, and trades these goods with another country. Trade is a positive-
Calculating Opportunity Costs Using Production Numbers (units produced per day per worker)
| Australia | New Zealand | |
| Boomerangs | 20 | 8 |
| Kiwi | 12 | 16 |
Opportunity cost of 1 boomerang:
Australia: 12 kiwi/20 boomerangs = 0.6 kiwi per boomerang.
New Zealand: 16 kiwi/8 boomerangs = 2 kiwi per boomerang.
Australia has a lower opportunity cost of producing boomerangs.
Opportunity cost of 1 kiwi:
Australia: 20 boomerangs/12 kiwi = 1.7 boomerangs per kiwi.
New Zealand: 8 boomerangs/16 kiwi = 0.5 boomerangs per kiwi
New Zealand has a lower opportunity cost of producing kiwi.

2.7 Countries export goods for which they have a comparative advantage, and import goods for which they do not, leading to gains from trade to both countries.