Chapter 1. Center Surround Fields
1.1 Introduction
Center-Surround Fields
In this experiment, you will examine a feature of the visual system. As cognitive psychology has developed, the understanding of the brain, neuroscience, has become more important. The study of the brain holds many surprises and often forces us to revise our ideas.
In the 1950s it became possible to use an electrode to record the activity of a single neuron. Stephen Kuffler (1953) took advantage of this new technology to record activity in the ganglion cells in the retina, where axons make up the optic nerve that carries visual information from the eye to the brain. He anesthetized a cat and found a ganglion cell in the retina. He could find the cell because, even in the dark, neurons fire action potentials at a slow, steady pace. When the electrode penetrated the ganglion cell, clicks would sound over the speaker to which the electrode was connected. When a cell was found, Kuffler would present different stimuli on a screen in front of the cat and see what happened to the cell. Since these are the cells that carry information from the eye to the brain, what happens in the cell has important implications for how we see and experience the world.
1.2 Experiment Setup

1.3 Instructions
Instructions
In this experiment, you will simulate recording the activity of a single ganglion cell in the retina. You will be asked to project different stimuli on the screen to see what happens to the firing rate of the cell. The screen will look something like this:
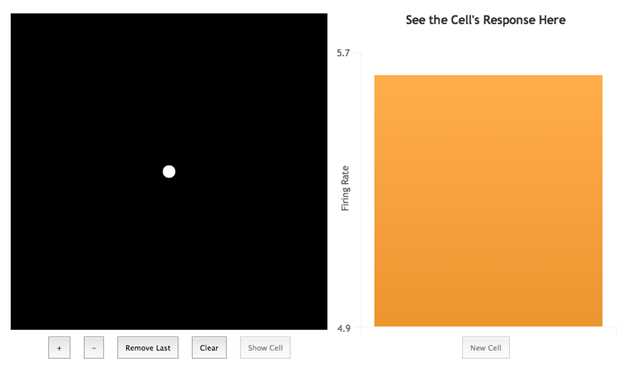
The black area on the left is a portion of the wall on which you can project stimuli using your mouse and controls at the bottom of the screen. On the right you will see the firing rate of the cell.
As you proceed through the experiment, you will be given different stimuli, such as dots and circle, to use. Follow the instructions in each step.
1.4 Experiment
Begin Experiment
1.5 Results
Results
1.6 Debriefing
Debriefing
Several interesting and important conclusions can be drawn from these experiment trials. Let us go through each experiment.
In Experiment 1 you mapped out the receptive field. The cell had either a central area where light excited the cell and a surrounding area that inhibited the cell, or the reverse. Thus, these cells are said to have a center-surround receptive field. It is interesting that the excitatory and inhibitory areas are gathered together into a pattern.
Experiment 2 gets more interesting and helps us understand these cells more clearly. The experiment started with no light on and then you added light to the center and made the light bigger until the whole receptive field was filled. When there is no light in the receptive field, the cell fires at a very slow firing rate. When the cell is on-center, that is, the central region is excitatory, and the center area is full of light but the surround has no light stimulating it, the cell fires at a very high rate. Finally, when the entire receptive field is full of light, the cell again fires at a very slow firing rate.
The excitatory and inhibitory areas we saw in experiment 1 work against each other. They cancel each other out. As a result, these receptive fields respond best when light fills only part of the receptive field, not the total amount of light that strikes the receptive field. Adding light to the inhibitory area of the receptive field adds light but reduced the firing rate of the cell.
Experiment 3 refines our findings a bit further. In this experiment you moved a bright edge, like the edge of a white piece of paper on a black background, across the receptive field. Again, the best responses depended on where the edge was in the receptive field. When the edge was outside of the receptive field so that the cell had either no light in it or all light, there was little response. The cell responded best when there was a change or edge in the receptive field. Think about reading: you have to move your eyes across the page. It is easiest to read when there is a big difference between the letters and the background, such as is typically the case with black letters on a white background. These receptive fields can pick up these black-on-white differences and use these edges to guide your eyes.
References:
Cornsweet, T. N. (1970). Visual Perception. New York: Academic Press.
Enroth-Cugell, C. & Robson, J. (1966). The contrast sensitivity of retinal ganglion cells of the cat. Journal of Physiology, 187, 517-566.
Kuffler, S. W. (1953). Discharge patterns and functional organization of mammalian retina. Journal of Neurophysiology, 16, 37-68.
1.7 Quiz
Quiz