Map
Mapping is similar to clustering in that it places related ideas about a topic in graphic form. Unlike clustering, however, mapping helps you define the relationships among your ideas. The practice is especially helpful if you are exploring a topic in terms of causes and effects, sequences of events, costs and benefits, or advantages and disadvantages. For example, you might create a map to predict what would happen if cigarette taxes were doubled. Or you might create a map to identify factors that led to an oil spill along the Oregon coast.
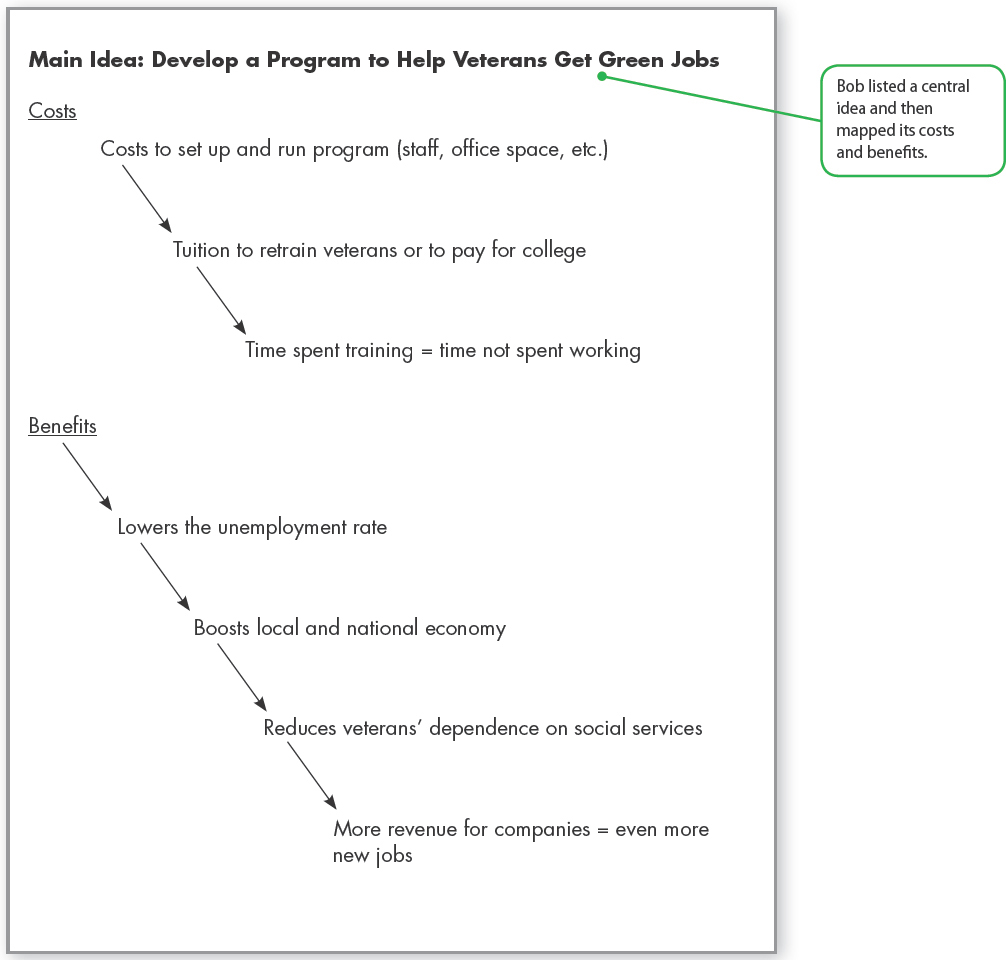
Bob used his word-processing program to create a map that explored the costs and benefits of a program that could help veterans return to civilian life.
To map a topic, place your main idea at the top of a page. If you are looking at more than one aspect of a topic, such as costs and benefits, list as many relationships as you can think of. If you are looking at causes and effects, start with a single effect. Then explore the topic by identifying related causes and effects, costs and benefits, advantages and disadvantages, and so on. For example, if you are mapping a topic using causes and effects, treat each effect as a new cause by asking yourself, “If this happened, what would happen next?” Then use arrows to show the consequences. If you are mapping a topic using costs and benefits, show groups of costs and identify the relationships among them.