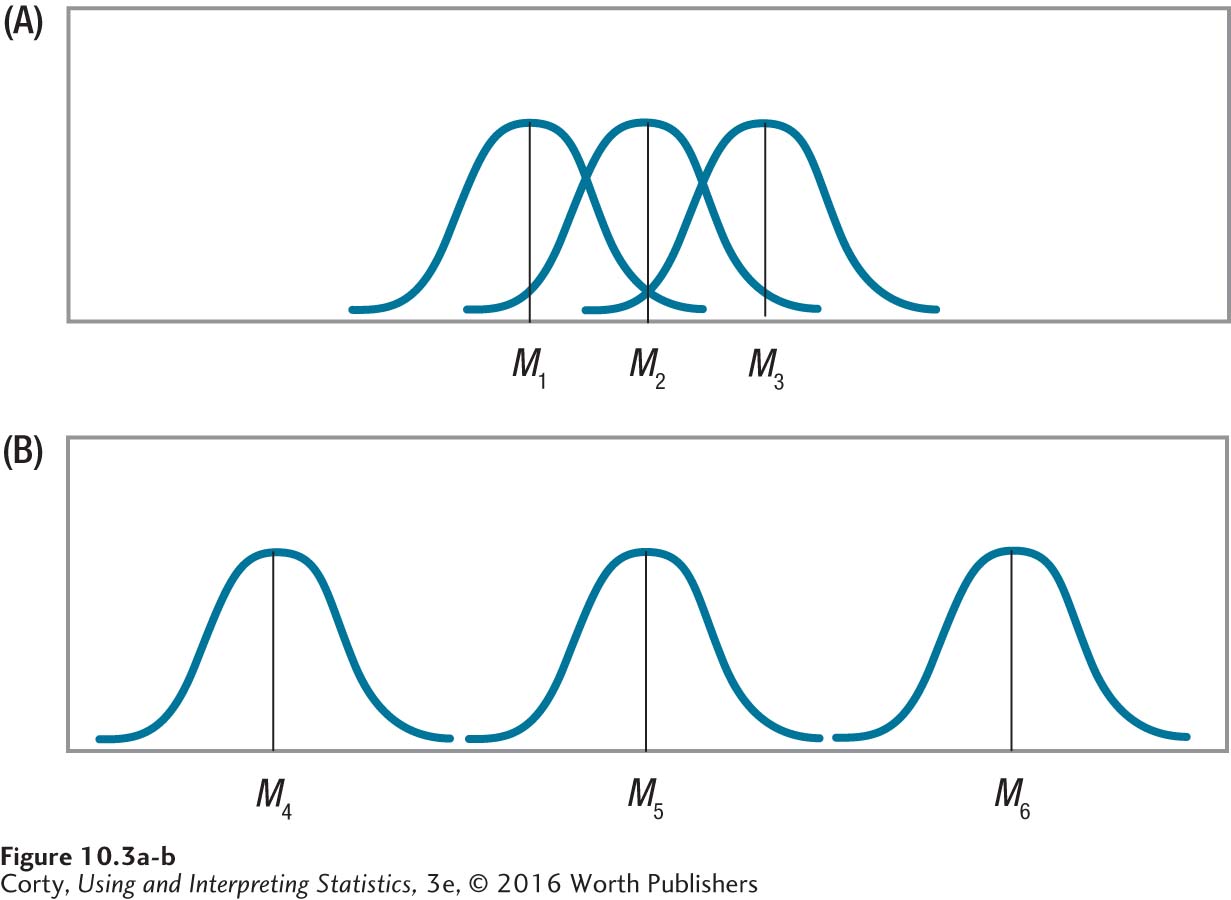
Figure 10.5: Figure 10.3 Examples of Little Impact of Treatment on Outcome and a Lot of Impact of Treatment on Outcome In the top panel (A), the three different treatments have about the same average effect on outcome. Note that the three means (M1 to M3) are very close to each other and that there is a lot of overlap in outcome from group to group. In contrast, the bottom panel (B) shows three treatments with very different effects on outcome. In it, the three means (M4 to M6) are further apart from each other and there is no overlap in outcome from group to group.