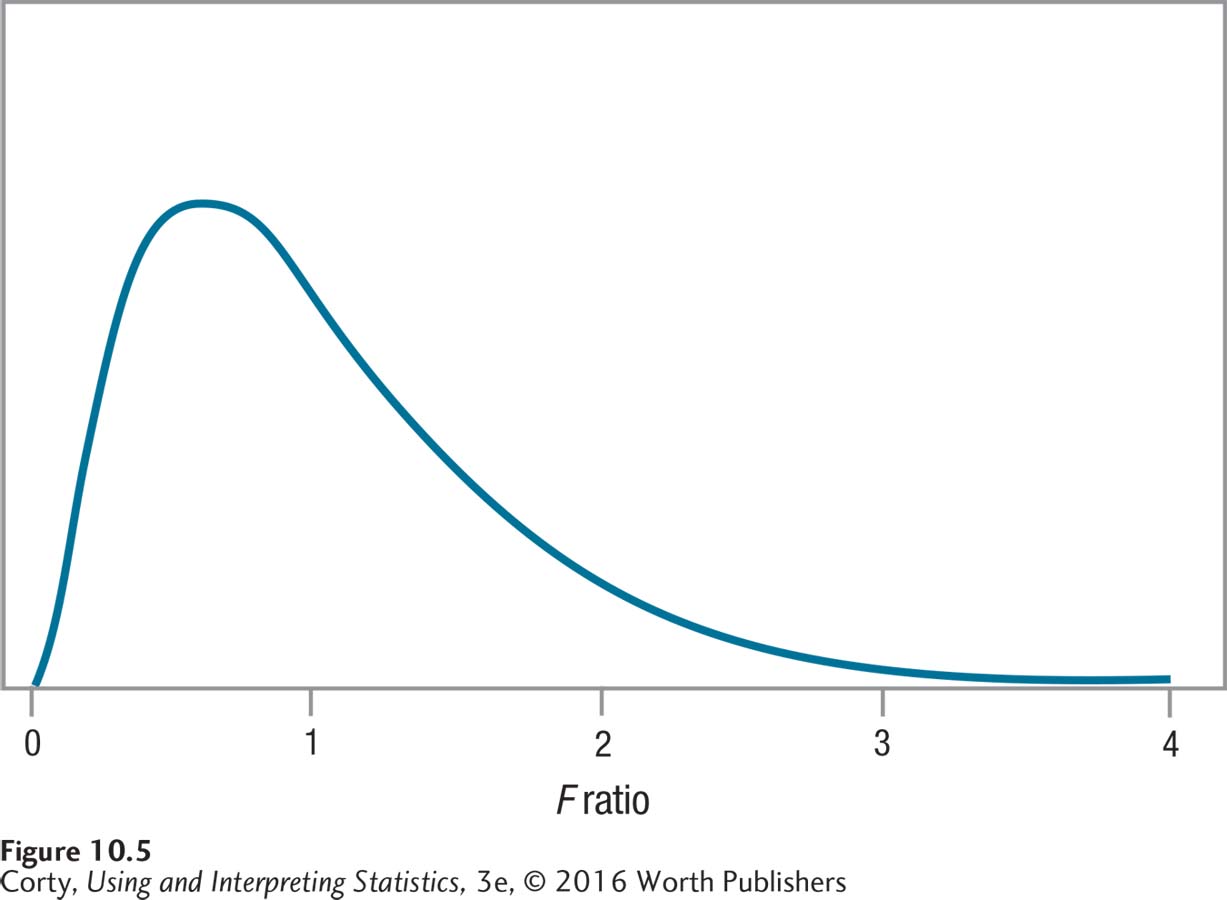
Figure 10.7: Figure 10.5 An Example of a Sampling Distribution for the F Ratio This is an example of a sampling distribution for the F ratio, the ratio of between-group variability to within-group variability. Note that F can’t be lower than zero, that the high point of the curve is close to a value of 1 on the X-axis, that the distribution is positively skewed, and that the probability decreases as F gets larger than 1.