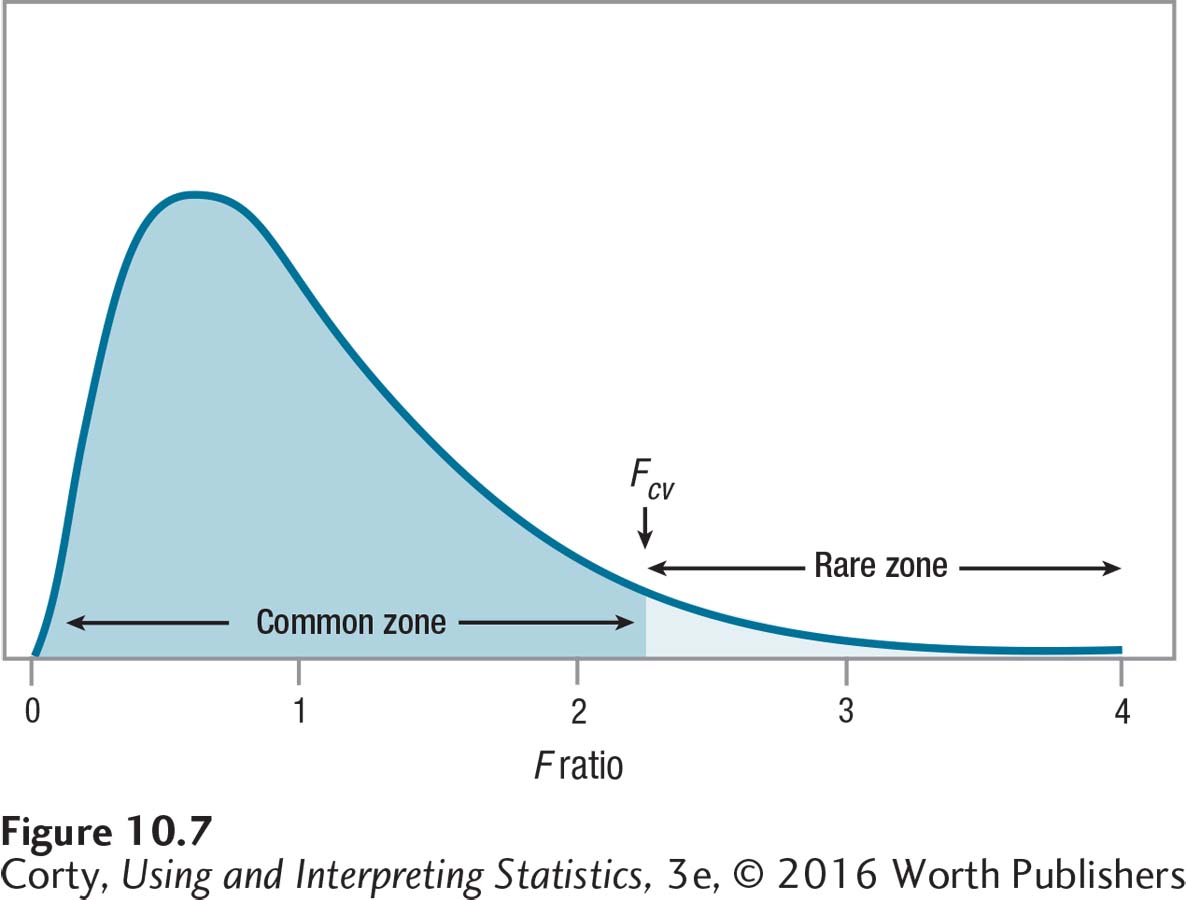
Figure 10.11: Figure 10.7 Using the Critical Value of F to Mark the Common Zone and the Rare Zone of the Sampling Distribution of F The critical value of F, Fcv, marks the boundary between the common zone and the rare zone of the test statistic. Here, 5% of the area under the curve falls in the rare zone that is on and to the right of Fcv.