Figure 11.2:
Figure 11.2
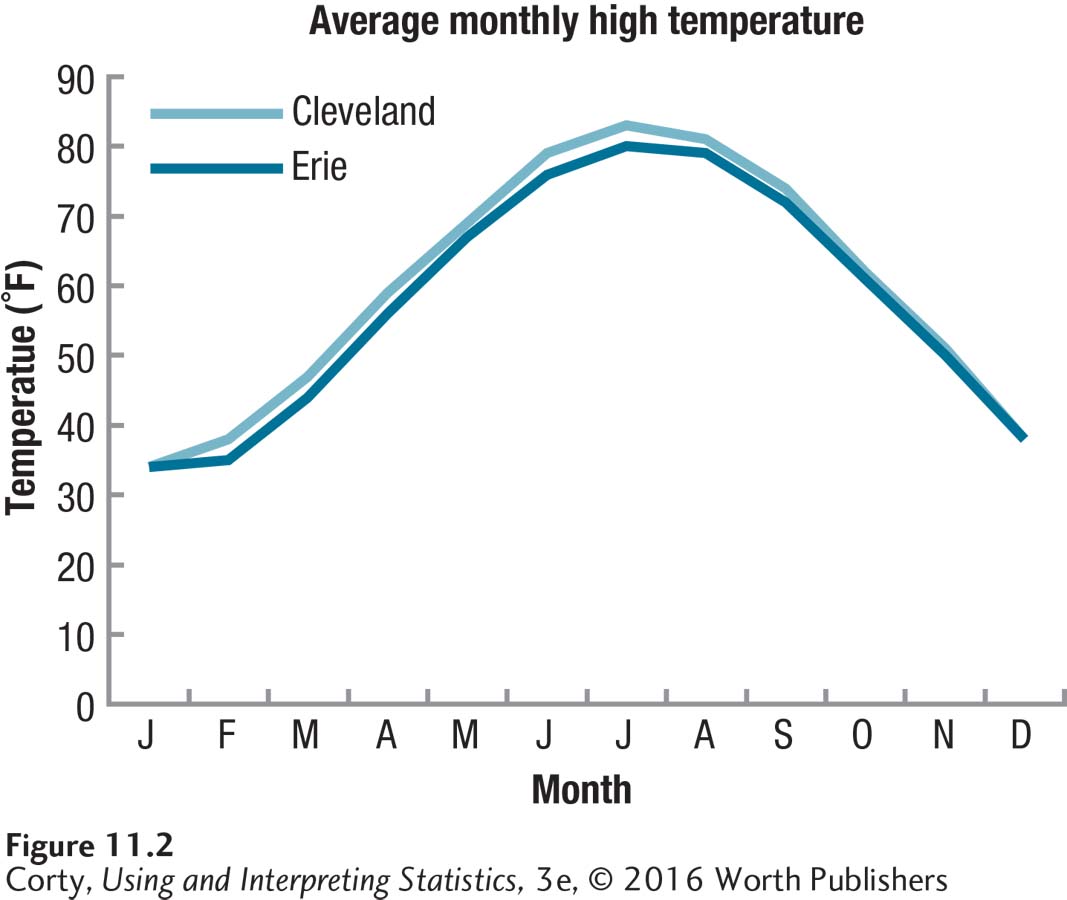
Average High Temperature per Month in Cleveland, OH, and Erie, PA
Notice how little difference there is in temperature between the two cities each month and how much variability exists from month to month.