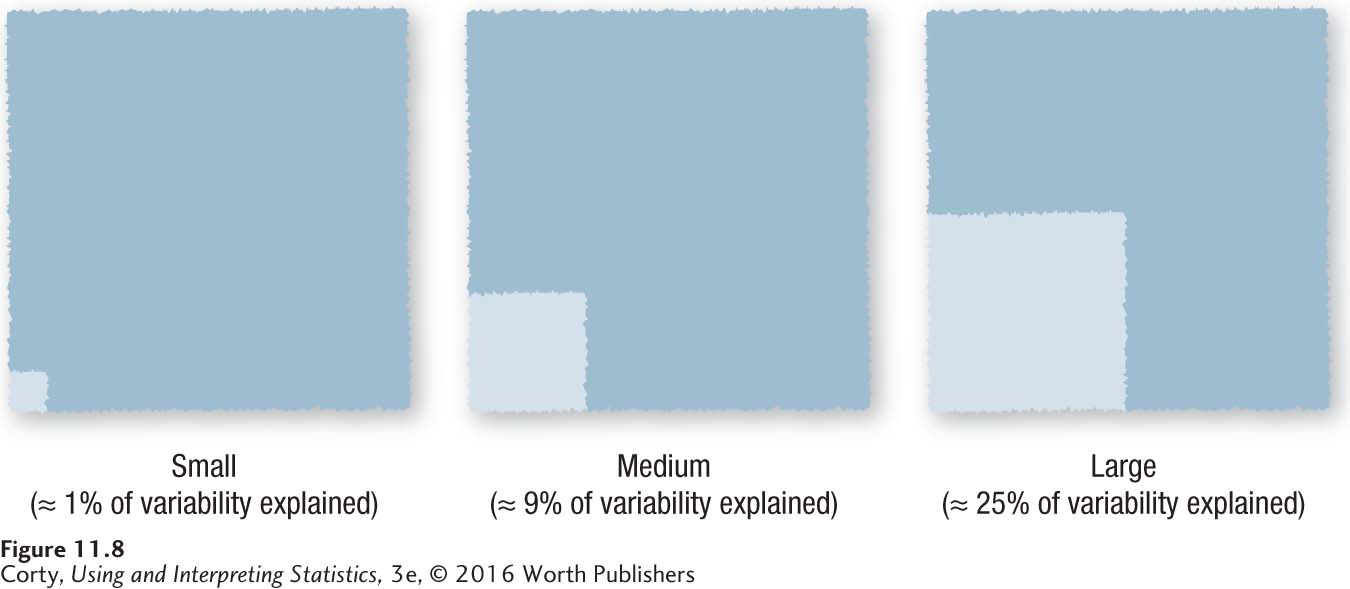
Figure 11.13: Figure 11.8 Graphic Representations of Cohen’s Small, Medium, and Large Effect Sizes Cohen (1988) considers a small effect one that explains about 1% of the variability in a dependent variable. A medium effect explains about 9% and a large effect about 25%. Each figure represents all 100% of the variability that is available to be explained in a dependent variable. The shaded portions represent the percentage of variability that is explained by the different effect sizes and the unshaded portions are left unexplained.