Figure 11.25:
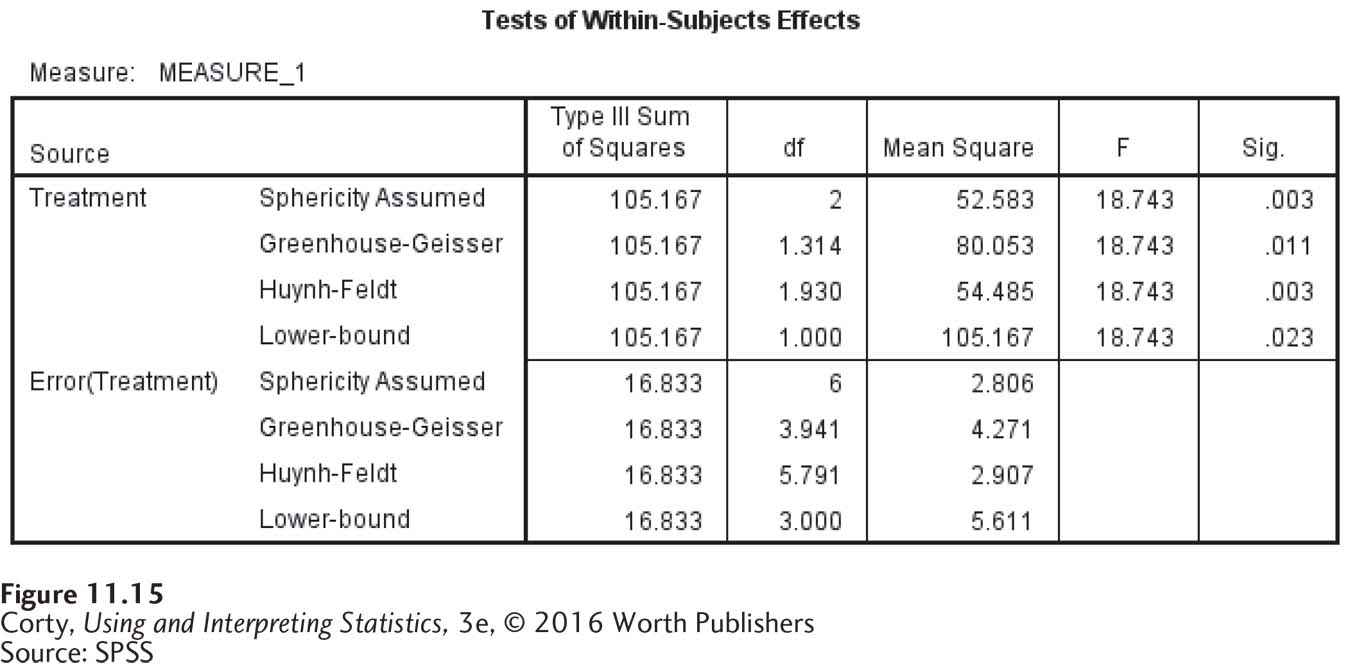
Figure 11.15
ANOVA Summary Table for One-Way, Repeated-Measures ANOVA in SPSS
The
F
ratio for the effect of treatment is displayed on the first line, the line for the effect with “Sphericity Assumed.”
(Source: SPSS)