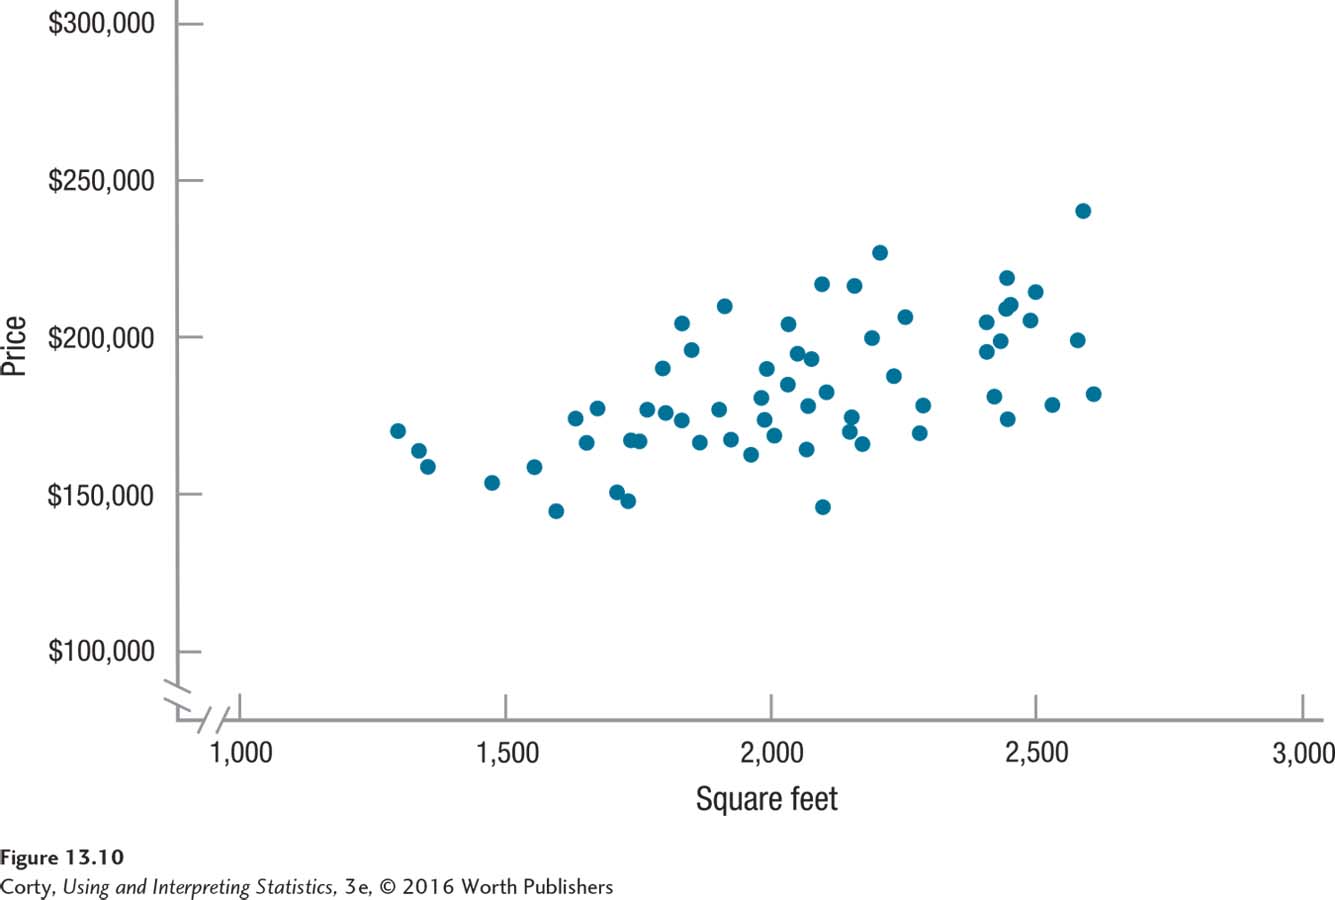
Figure 13.12: Figure 13.10 Positive Relationship Between the Size of a House and Its Cost In a positive relationship, the data points in a scatterplot fall along a diagonal line that moves up and to the right. In this scatterplot, as the size of the house increases, the price generally does as well.