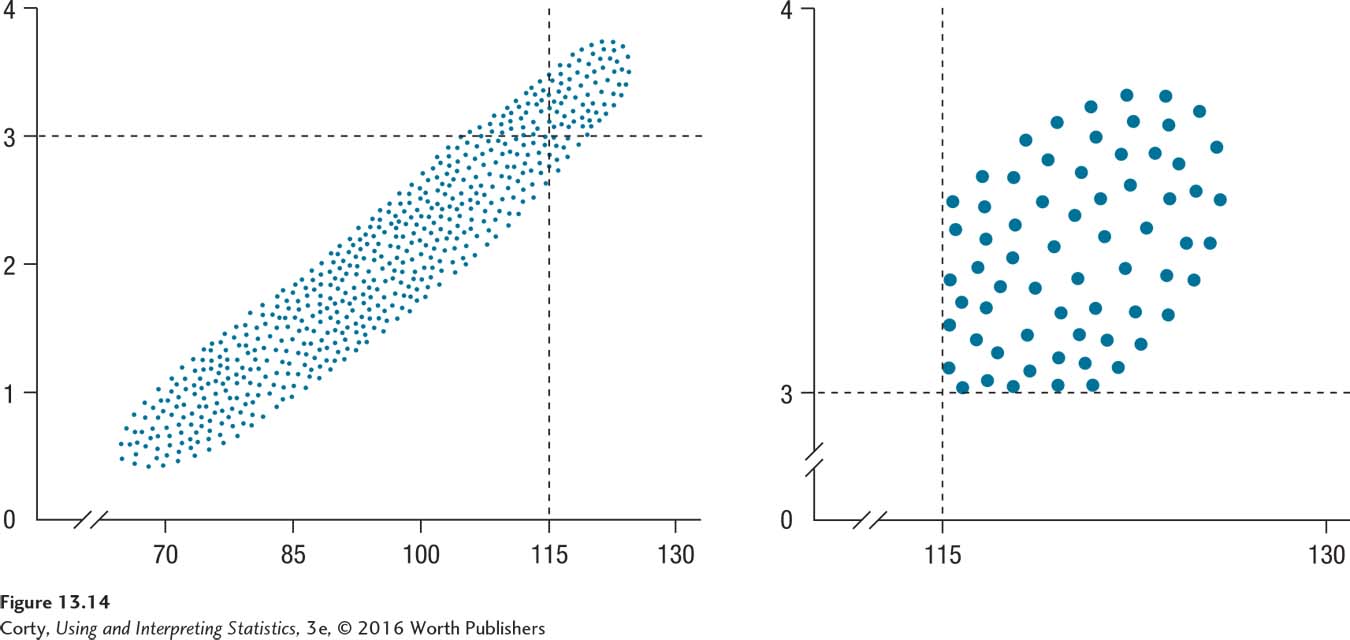
Figure 13.16: Figure 13.14 Effect of Restriction of Range on Correlation Coefficients The left scatterplot shows the strong relationship between IQ and GPA for a large sample of high school students. The right scatterplot depicts the relationship when the analysis is restricted to people with IQs of 115 or higher and GPAs of 3 or higher. Note how the shape of this sample with restricted ranges on both variables is more circular, which means the relationship between IQ and GPA will be much weaker. A restricted range deflates the value of a correlation.