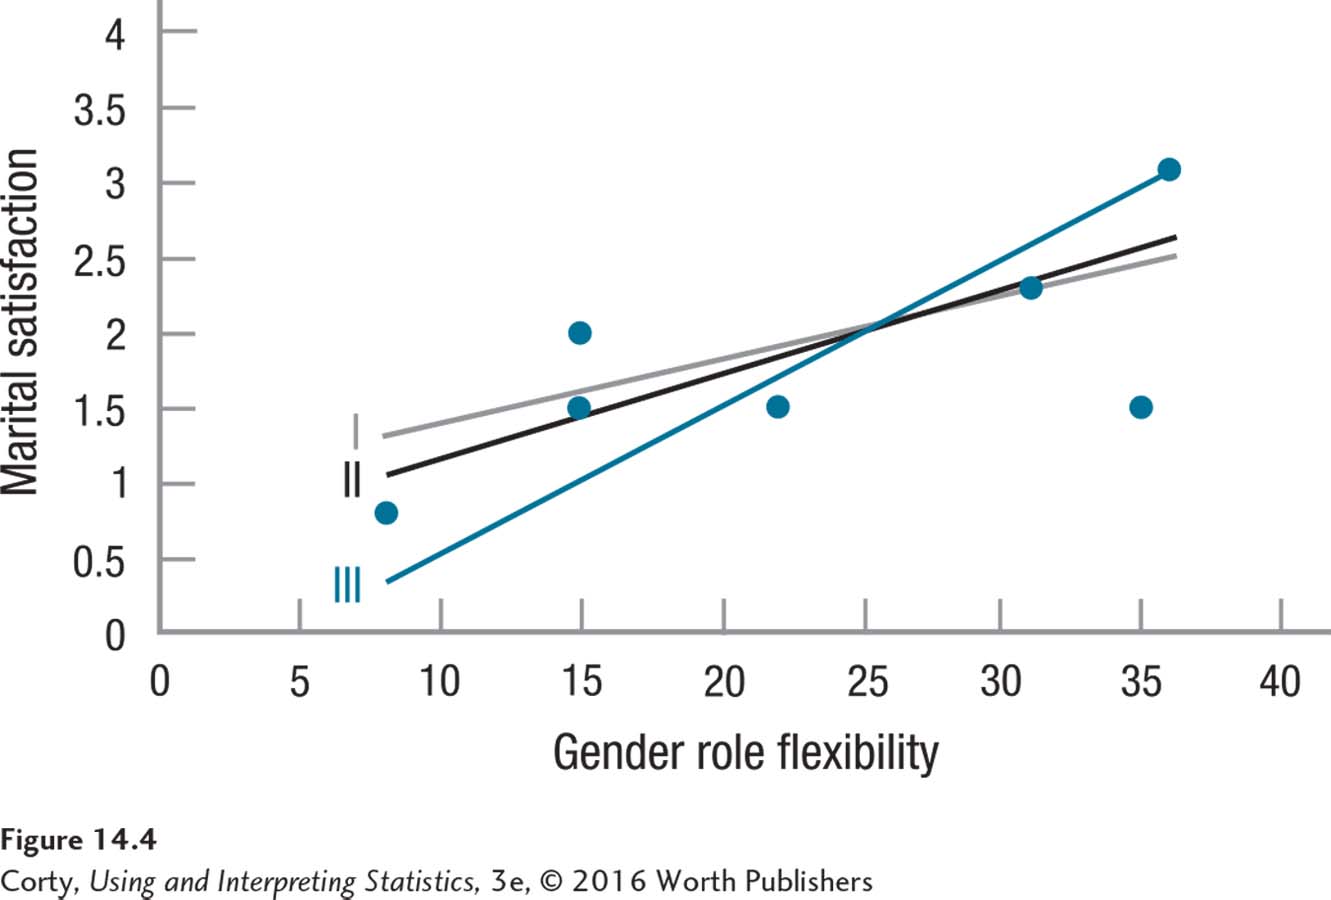
Figure 14.4: Figure 14.4 Three Potential Regression Lines for Predicting Marital Satisfaction Which of these three lines best “fits” the data in this scatterplot? By what criterion should one decide? Statisticians use the “least squares” criterion, which means the best-fitting line is the one that, overall, minimizes the discrepancies between actual Y scores and predicted Y scores.