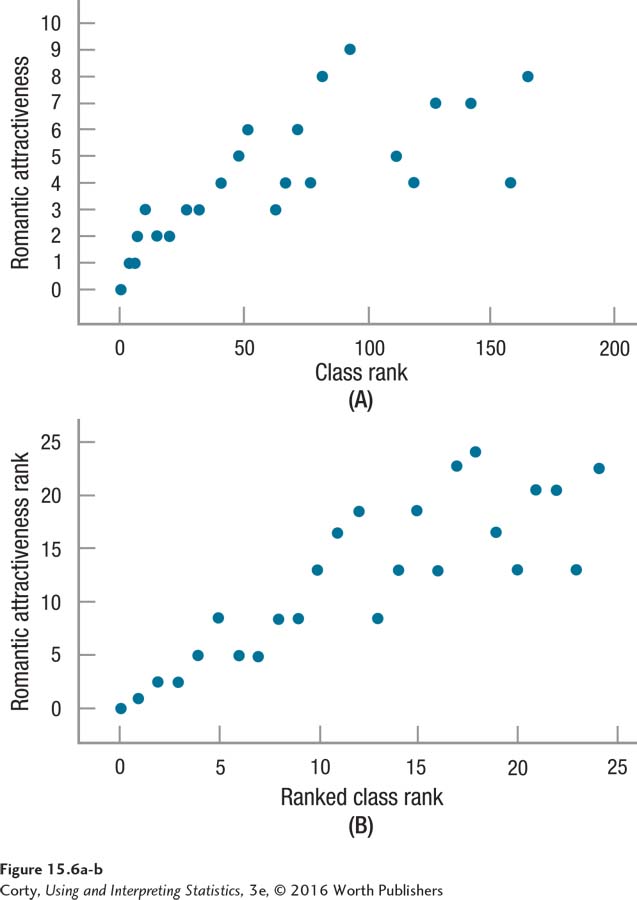
Figure 15.17: Figure 15.6 Relationship Between Academic Success and Romantic Attractiveness for Unranked Data and Ranked Data Both scatterplots show the relationship between a student’s class rank and his or her desirability as a romantic partner. In the top graph (A), the naturally occurring range is used for each variable. In the bottom graph (B), the variables have been converted to ranks. For example, in Panel A, the X-axis ranges from 0 to 200, which is sufficient to capture the person with the highest class rank, 165. In Panel B, when the class ranks are ranked from 1 to 24, the person with a rank of 165 now has a score of 24 and the X-axis only has to go up to 25.