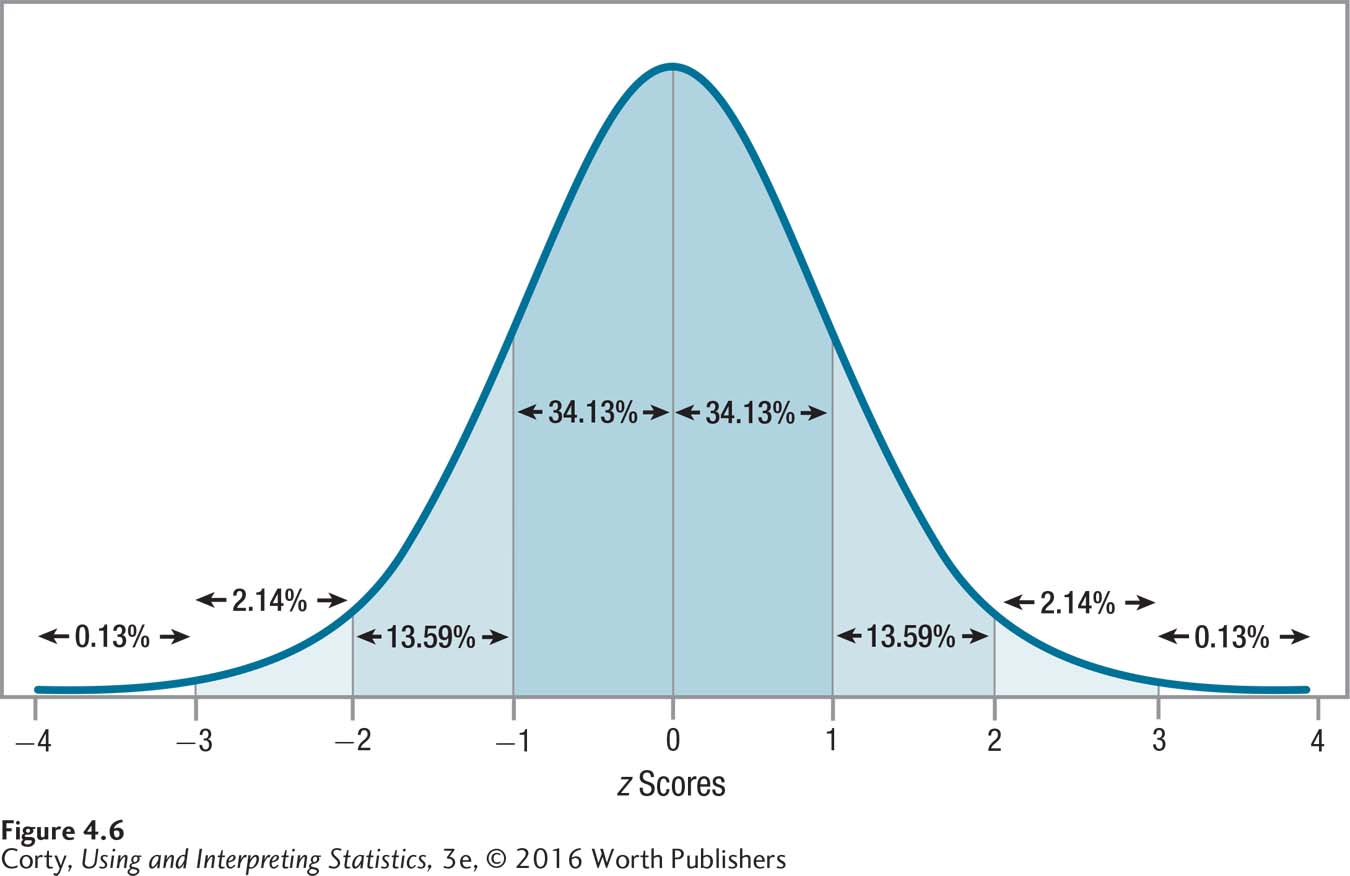
Figure 2.7: Figure 4.6 Percentage of Cases Falling in Specified Regions of the Normal Distribution The normal distribution is defined by the percentage of cases that fall within specified regions. This figure shows the percentage of cases that fall in each standard deviation as one moves away from the mean. Note the symmetrical nature and how the percentage of cases drops off dramatically as one moves away from the mean. Theoretically, the curve extends out to infinity, with fewer and fewer cases in each standard deviation.