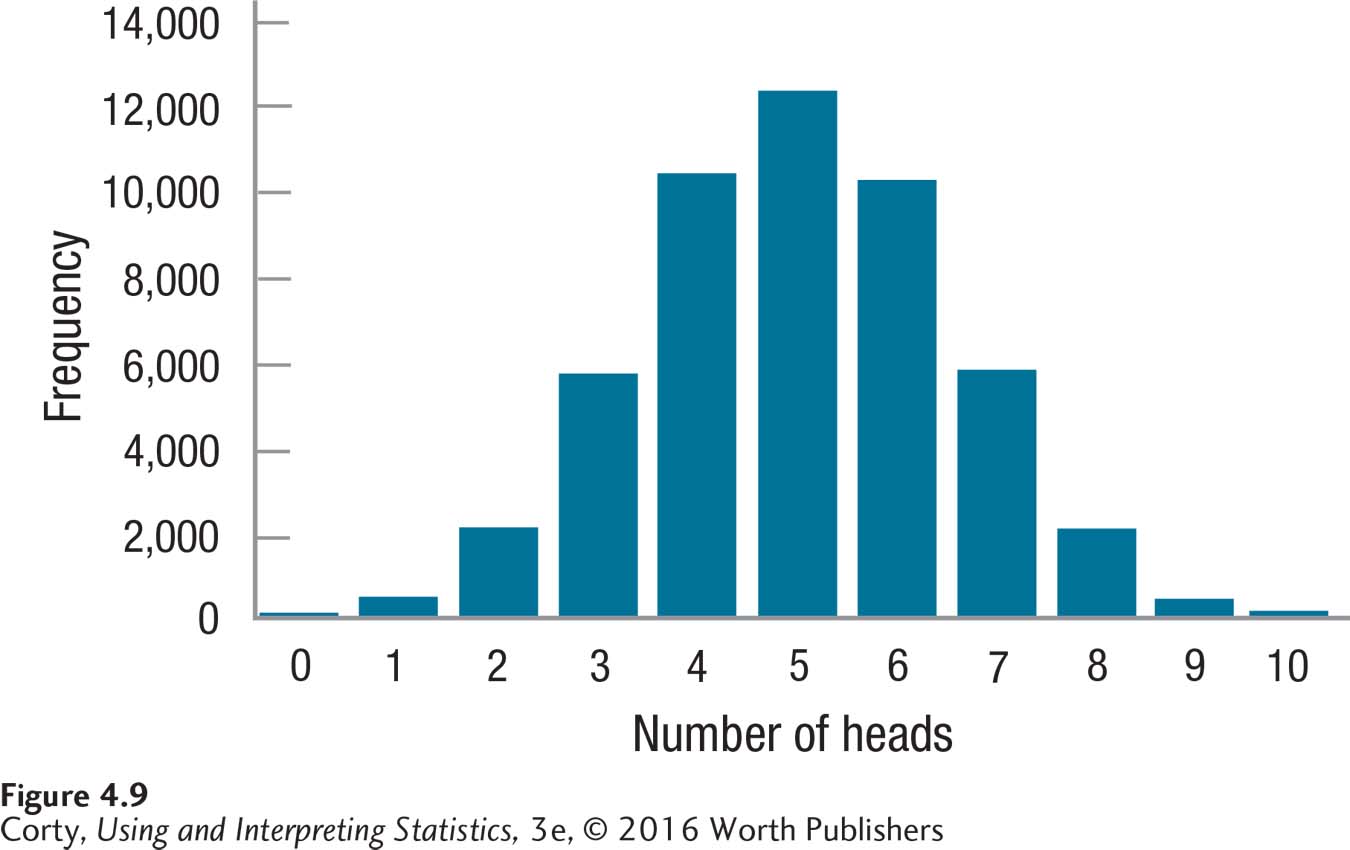
Figure 2.10: Figure 4.9 Approximation of Normal Distribution for Number of Heads for 10 Coins Tossed Together 50,000 Times If one tossed 10 coins 50,000 times and counted the number of heads, the distribution might look like this. Though this is a bar graph for discrete data, it has a normal shape like that seen for a continuous variable in Figure 4.5.