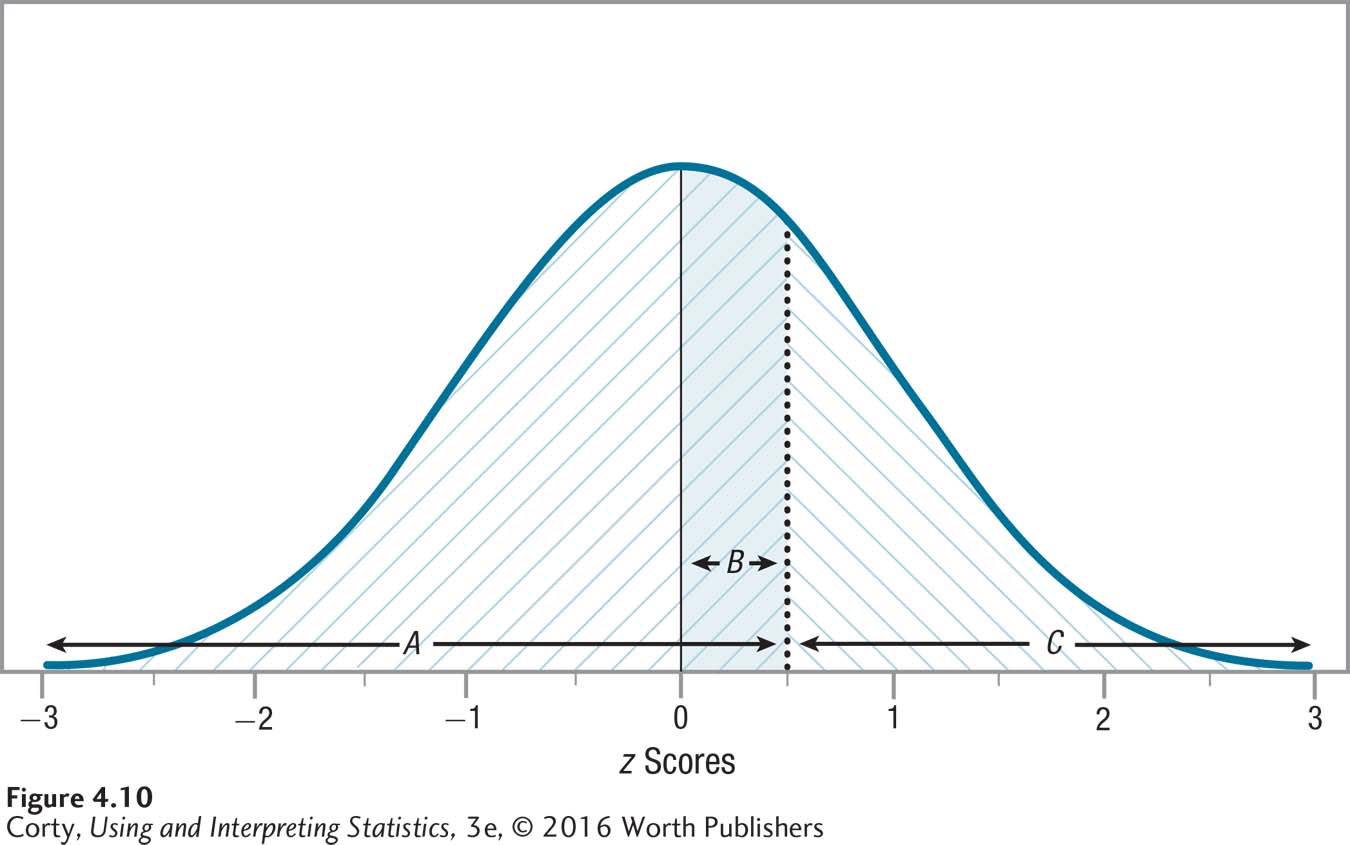
Figure 2.12: Figure 4.10 Finding Areas Under the Curve for a z Score of 0.50 Area A, marked / / / , is the portion of the normal curve that falls below z = 0.50. Area B, the shaded area, is the section from the mean to z = 0.50. Area C, marked \ \ \, is the section that falls above z = 0.50. These areas, A, B, and C, correspond to the columns A, B, and C in Appendix Table 1.