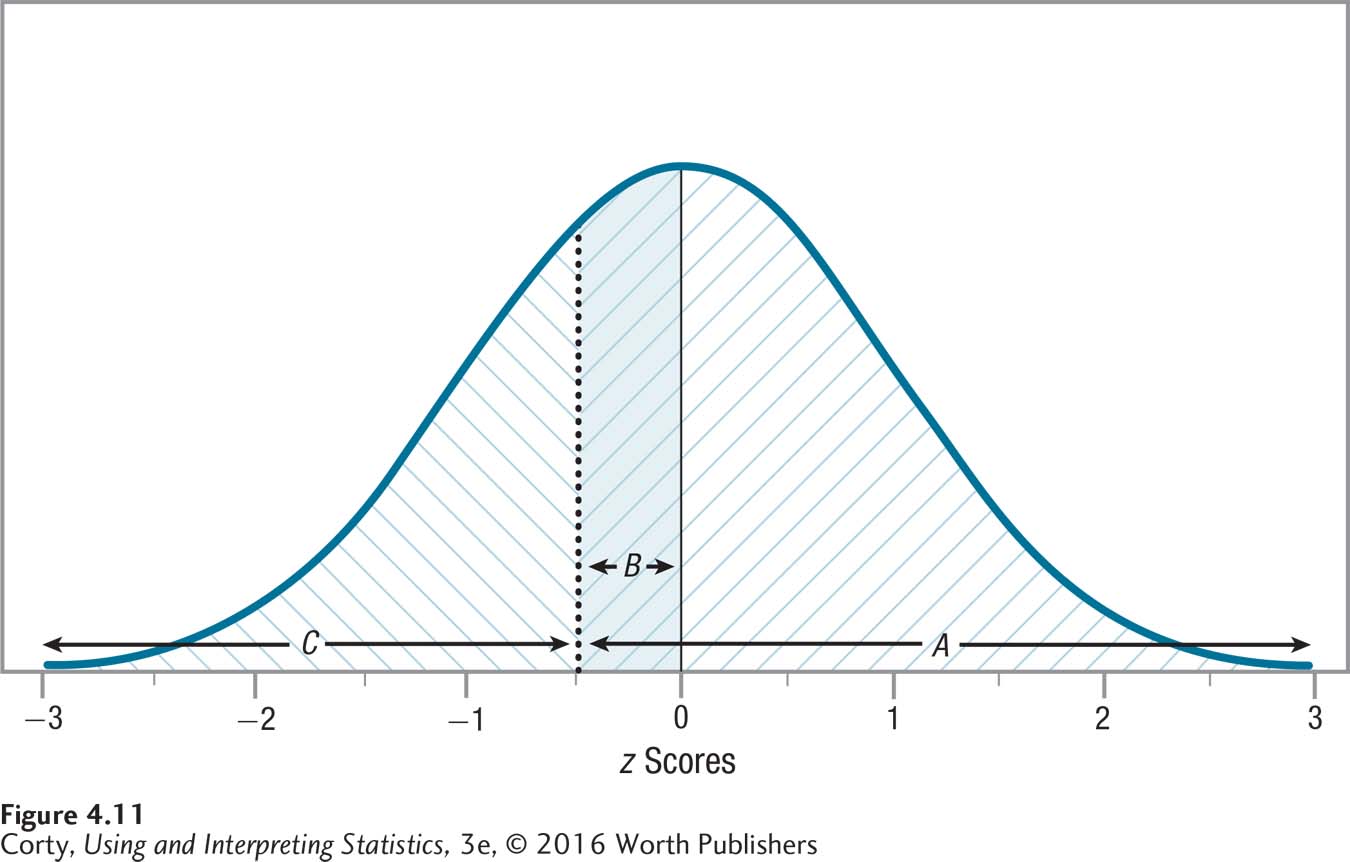
Figure 2.13: Figure 4.11 Finding Areas Under the Curve for a z Score of –0.50 Compare this Figure to Figure 4.10. Note that the area A is the same in Figure 4.10 as here in Figure 4.11, but the side of the normal distribution it is on has changed as the sign of the z score changes. This shows the symmetry between positive and negative z scores. The same is true for area B in the two figures and for area C.