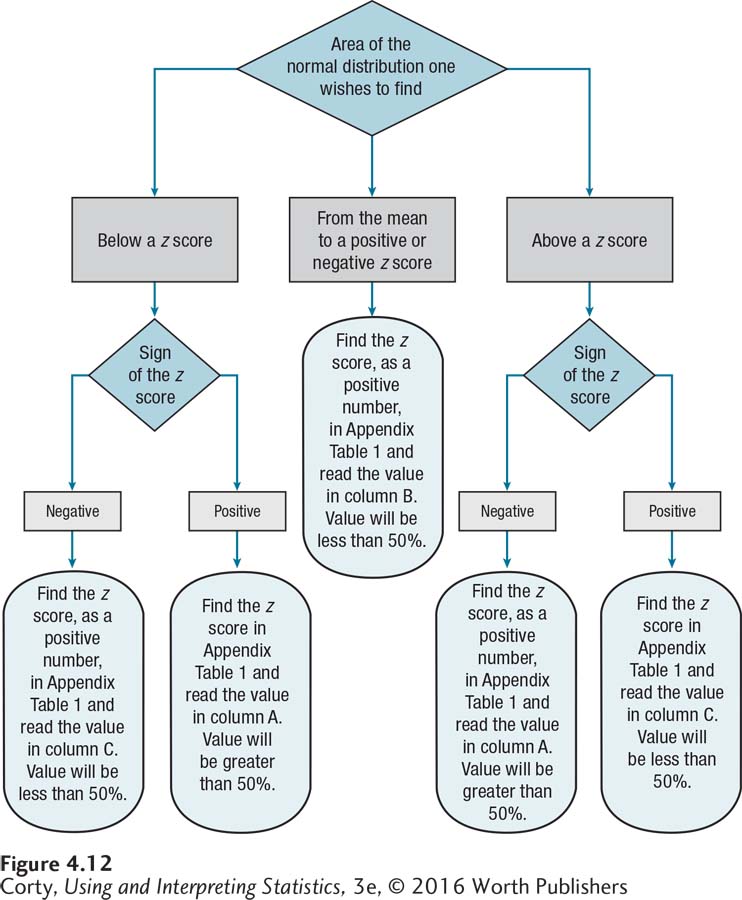
Figure 2.14: Figure 4.12 How to Choose: Flowchart for Finding Areas Under the Normal Curve It is always a good idea to make a sketch of the normal distribution and shade in the area one wishes to find in order to make a rough estimate. Then, use this flowchart to determine which column (A, B, or C) of Appendix Table 1 will lead to the exact answer.