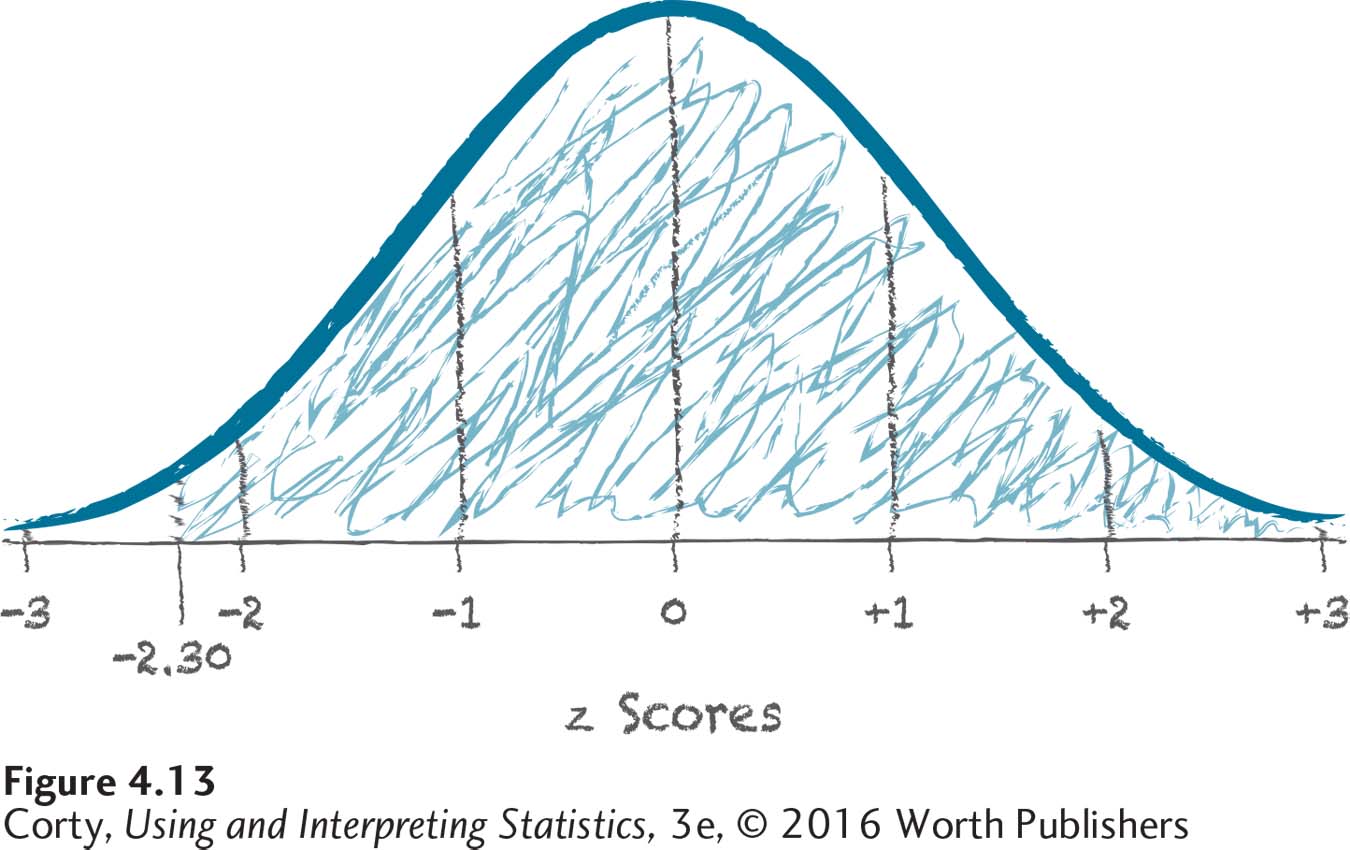
Figure 2.15: Figure 4.13 Sketch for Finding Area Above a z Score of −2.30 This figure marks the area in a normal distribution that falls above a z score of –2.30. The area includes the section to the right of the midpoint, so the total has to be greater than 50%. Inspection of the figure suggests that the area will be close to 100%.