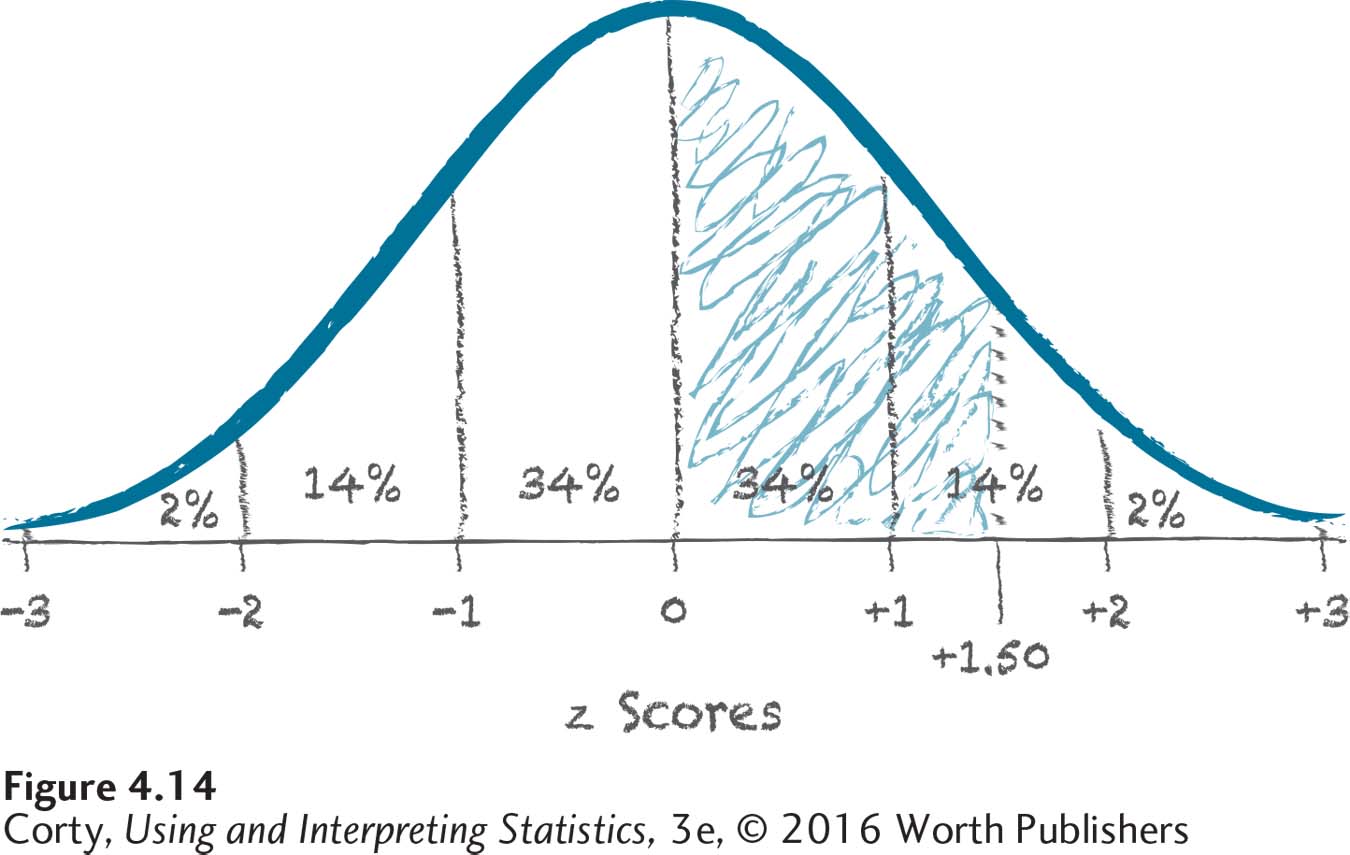
Figure 2.16: Figure 4.14 Sketch for Finding Area from the Mean to a z Score of 1.50 This figure marks the area in a normal distribution falling from the mean to a z score of 1.50. The numbers (34%, 14%, and 2%) that represent the approximate percentages in each standard deviation help estimate how much area the shaded area represents.