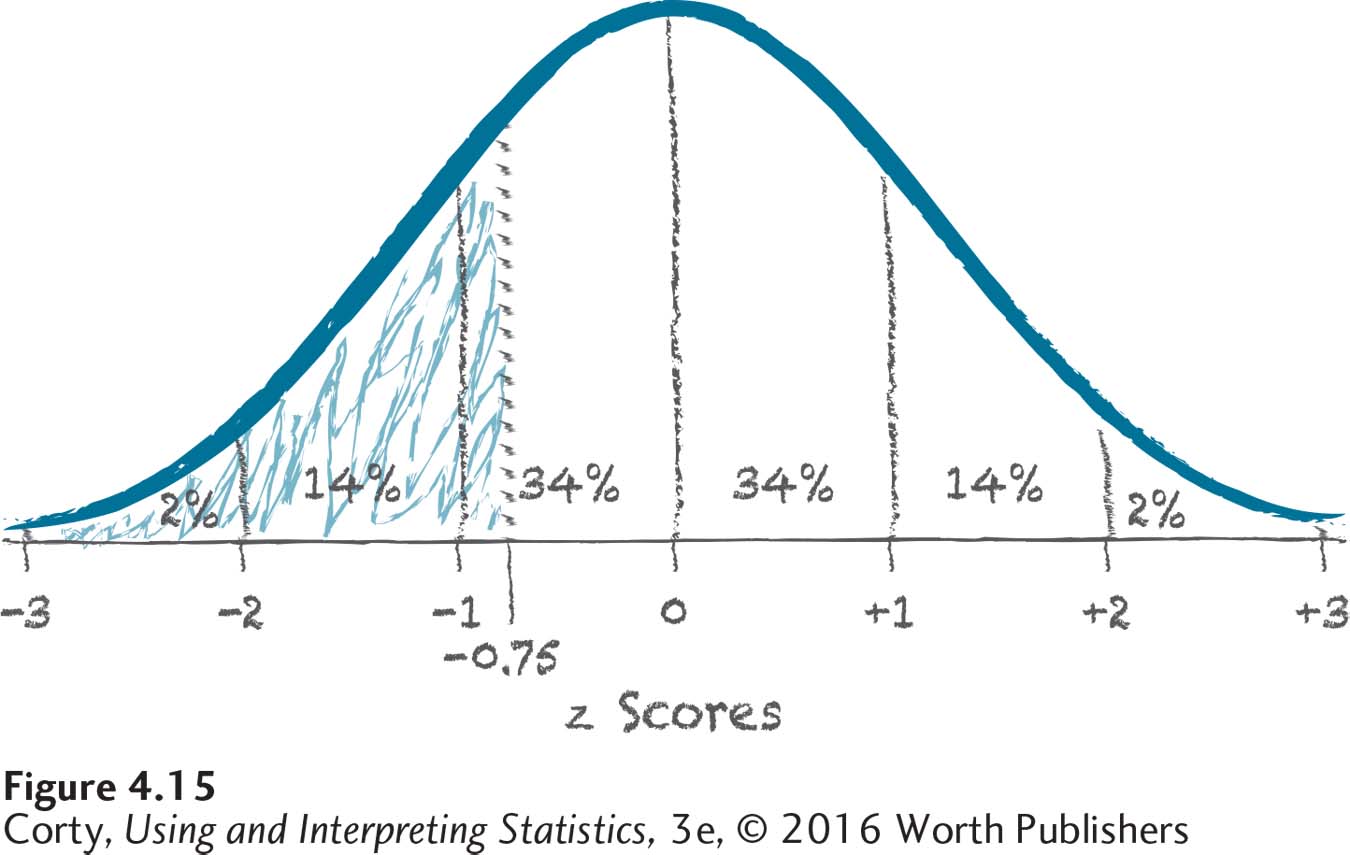
Figure 2.17: Figure 4.15 Sketch for Finding Area Less Than a z Score of –0.75 This figure marks the area in a normal distribution falling below a z score of –0.75. The numbers (34%, 14%, and 2%) that represent the approximate percentages in each standard deviation help estimate how much area the shaded area represents. The shaded area will be a little bit more than 16%.