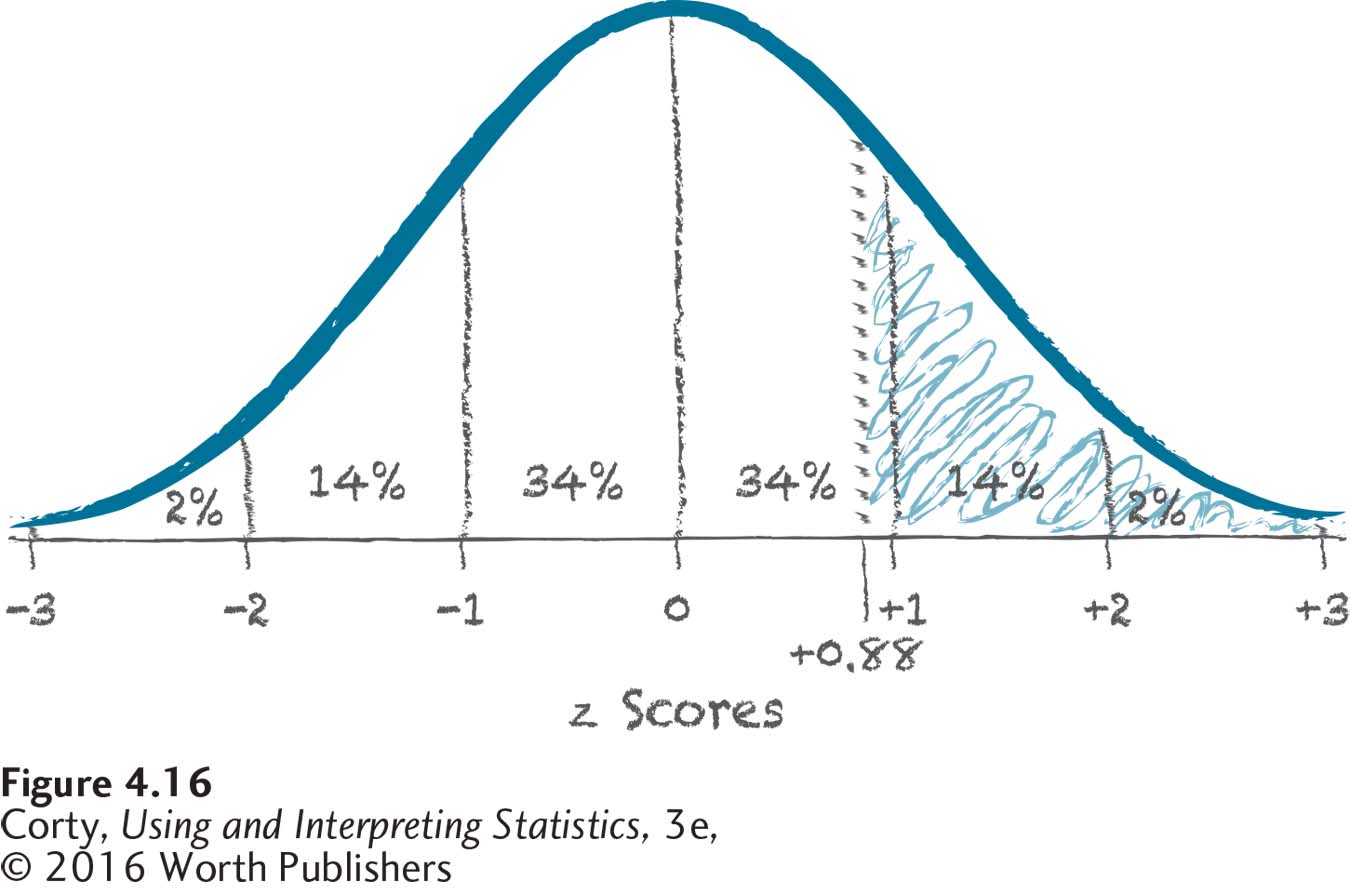
Figure 2.18: Figure 4.16 Sketch for Finding Probability of Having a Pregnancy That Lasts Two or More Weeks Longer Than Average The dotted line at z = 0.88 marks the area where deliveries two weeks later than average start. The numbers (34%, 14%, and 2%) that represent the approximate percentages in each standard deviation help estimate how much area the shaded area represents. The area will be a little bit more than 16%.